Download presentation
Presentation is loading. Please wait.

1
Clean Air Act Amendments, Wilderness Act, and Organic Act have mandates to protect Class 1 Areas Wilderness Act: Areas are “administered… in such a manner as will leave them “unimpaired for future use and enjoyment as wilderness” Organic Act: Leave resources “unimpaired for the enjoyment of future generations” Clean Air Act Preserve, protect and enhance air quality... and protect air quality related values (soil, water, flora, fauna, visibility)... in national parks…
... in national parks….")
2
Loch Vale Watershed Foundations 22+ years of long-term monitoring Experiments in field and laboratory to test cause and effect Modeling of ecosystem processes and “what-if” scenarios Spatial comparisons in Colorado and across western US Invaluable dataset for answering many different questions! Started with acid rain, now used for nitrogen saturation, mercury deposition, climate change, fundamental hydrology, biogeochemistry, and ecology.

3
Precipitation Vegetation Soils Bedrock Outflow Sediments Freshwater Biota Loch Vale Watershed Conceptual Model

4
Ecological Effects of Nitrogen Deposition at Rocky Mountain National Park Jill S. Baron, US Geological Survey M.Hartman, D.S.Ojima, K. Nydick, H.M. Rueth, B.Moraska Lafrancois, A.P. Wolfe, J. Botte, W.D. Bowman

5
Pathways and Effects of Excess Nitrogen Deposition N Deposition Fertilization Loss of Soil Buffering Changes in Aquatic Species Lake Eutrophication Loss of Lake ANC (acidification) N Saturation Changes in Plant Communities
 N Saturation Changes in Plant Communities")
6
In the alpine nitrogen favors sedges and grasses over flowering plants Niwot Ridge research shows sedges and grasses grow better with N than flowering plants in both experiments and surveys (Korb and Ranker 2001; Bowman et al. in press)
.")
7
East-side forests are closer to N saturation East side stands differed significantly from west side forests: - higher needle and soil N, - lower C:N ratios, - higher soil N cycling rates Six pairs of sites were similar in all characteristics except for N deposition amount N. Doesken Baron et al. 2000, Rueth & Baron 2001, Rueth et al. 2003

8
As soils accumulate N, microbial activity increases Similar patterns in New England, USA McNulty et al. 1991 Colorado Front Range Baron et al. 2000 Rueth & Baron 2001

9
Nitrate in ROMO Clow et al. 2001 Baron et al. 2000 Means (ueq/L) East10.5 (5.0) West 6.6 (4.3) n=44, p = 0.02
 East10.5 (5.0) West 6.6 (4.3) n=44, p =")
10
after Stoddard, 1994 North American watersheds Loch Vale 0 1 2 3 4 5 6 7 8 9 10 N wet deposition, kg/ha/yr 01234567891011121314 N export, kg/ha/y Watershed Nitrogen Saturation

11
Andrews Creek fr Thatchtop

12
Streams 18O (NO3) Winter snow Rainfall Snowmelt Microbial nitrate Spring snow Groundwater Loch Vale nitrate isotopes, 1995
 Winter snow Rainfall Snowmelt Microbial nitrate Spring snow Groundwater Loch Vale nitrate isotopes, 1995")
13
Nitrate concentrations are increasing in Loch Vale streams ANDREWS CREEK Alpine 1992-1998 mean =~25 ueq/L THE LOCH OUTLET Subalpine 1992-1998 mean =~16 ueq/L

14
Lake sediments extend records into the past Wolfe et al., 2001, 2003, Das et al. 2005 Saros et al. 2005, Baron et al. 1986

15
Diatoms are good indicators of environmental change Diatoms are algae: single-celled aquatic plants Species are very sensitive to water chemistry Glass (silica) cell walls do not decompose Each species has unique cell walls
 cell walls do not decompose Each species has unique cell walls")
16
Asterionella formosa Fragillaria crotonensisAulacoseira spp. Sky Pond Diatom Indicators of Disturbance Increased Abruptly in east-side lakes ca. 1950-1960 1950

17
Experiments with Bioassays (Bottles), Mesocosms (Hula Hoops), and Lakes Lafrancois et al. 2003, 2004, Nydick et al. 2003, 2004a, b

18
Experiments: Productivity increased with added N and N+P. Communities changed to nutrient-loving algae. Chrysophytes Green Algae N Additions = Eutrophication increased productivity changed algal community Dinobryon sp. Chlamydomonas sp.

19
Conclusions On the east side of the Front Range changes have been observed in: –Alpine tundra –Forests –Soils –Lakes and streams –Lake biota Experiments support nitrogen as the cause

20
What Happens Next? Nitrate is a strong acid anion. Nitrogen saturation leads to acidification. Hundreds of studies funded by NAPAP and its European counterpart show strong biological responses to acidification.

21
Reversal? Changes in species Increased productivity Increased microbial activity Increased soil N Nitrogen saturation Depletion of base cations, mobilization of aluminum Forest dieback Episodic/chronic acidification of waters Declines in species richness and abundance Loss of fish Eutrophication Acidification Increased N and acid deposition

22
Nitrogen emissions, transport, and deposition NPS, USDA-FS, EPA, NSF, Universities Colorado DPHE & local partners Don Campbell Dave Clow Alisa Mast George Ingersoll Leora Nanus

23
Global N budget ~1860

24
Global N Budget present

25
Nitrogen in atmospheric deposition Source >>>Emissions >>>Wet Deposition Combustion: Vehicles Energy development Energy production NO x (Nitrogen oxides-gases) NO 3 - (Nitrate- dissolved + particulate) Agriculture Livestock production Crop production NH 3 (Ammonia gas) NH 4 + (Ammonium- dissolved + particulate)
 NO 3 - (Nitrate- dissolved + particulate) Agriculture Livestock production Crop production NH 3 (Ammonia gas) NH 4 + (Ammonium- dissolved + particulate)")
27
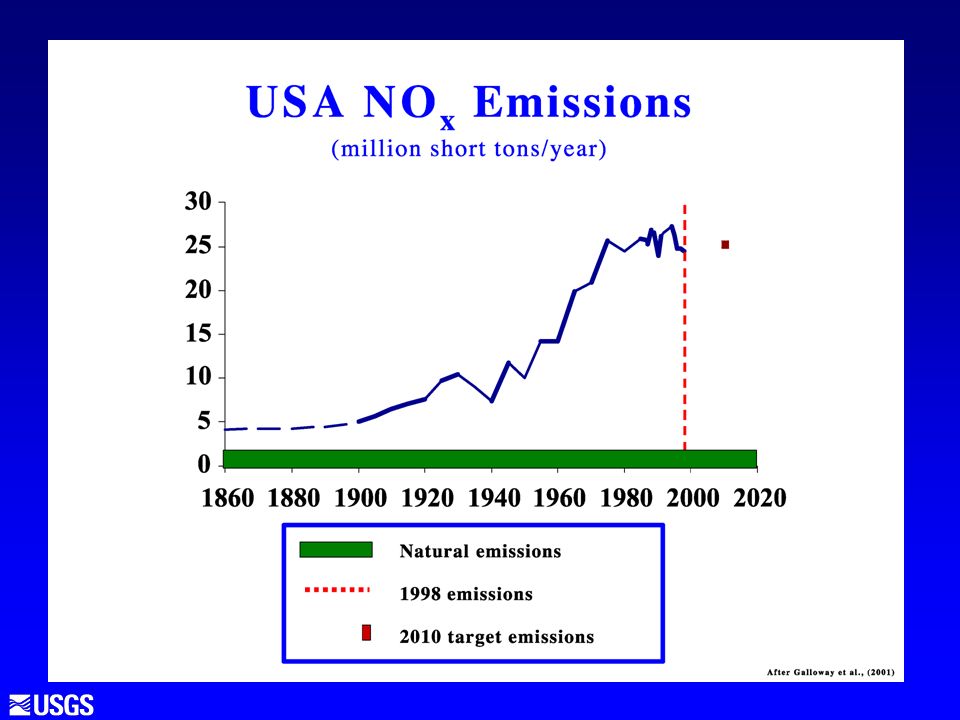
Total NO x emissions -- includes mobile and non-point sources

28
Nitrate Ion Concentrations 1985-2003 1985 19861984 National Atmospheric Deposition Program / National Trends Network

29
Nitrate Ion Concentrations 1985-2003 1986 19871985

30
Nitrate Ion Concentrations 1985-2003 1987 19881986

31
Nitrate Ion Concentrations 1985-2003 1988 19891987

32
Nitrate Ion Concentrations 1985-2003 1989 19901988

33
Nitrate Ion Concentrations 1985-2003 1990 19911989

34
Nitrate Ion Concentrations 1985-2003 1991 19921990

35
Nitrate Ion Concentrations 1985-2003 1992 19931991

36
Nitrate Ion Concentrations 1985-2003 1993 19941992

37
Nitrate Ion Concentrations 1985-2003 1994 19951993

38
Nitrate Ion Concentrations 1985-2003 1995 19961994

39
Nitrate Ion Concentrations 1985-2003 1996 19971995

40
Nitrate Ion Concentrations 1985-2003 1997 19981996

41
Nitrate Ion Concentrations 1985-2003 1998 19991997

42
Nitrate Ion Concentrations 1985-2003 1999 20001998

43
Nitrate Ion Concentrations 1985-2003 2000 20011999

44
Nitrate Ion Concentrations 1985-2003 2001 20022000

45
Nitrate Ion Concentrations 1985-2003 2002 20032001

46
Nitrate Ion Concentrations 1985-2003 2003 20042002

47
Nitrate Ion Concentrations 1985-2003 1985 19861984

48
Nitrate Ion Concentrations 1985-2003 2003 20042002

49
Percent change in NO 3 - in wetfall Lehmann et al., Environmental Pollution 2005

50
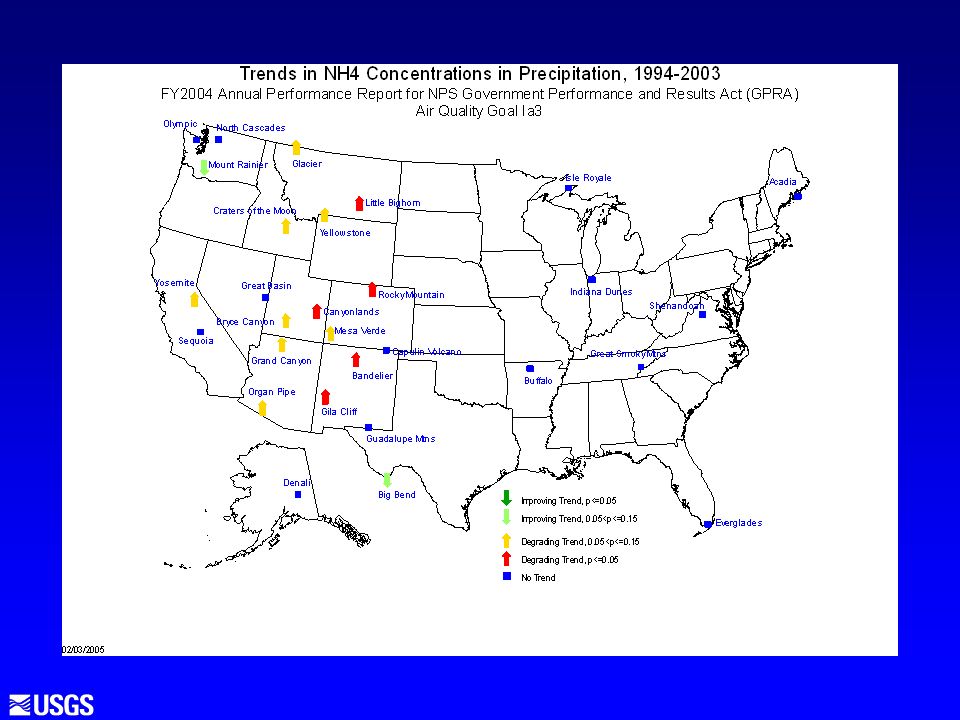
Downward pointing arrows denote trends toward decreasing nitrate (NO 3 ) concentrations and improving air quality. Similarly, the up arrows correspond to trends toward higher nitrate concentrations and hence worsening air quality.

52
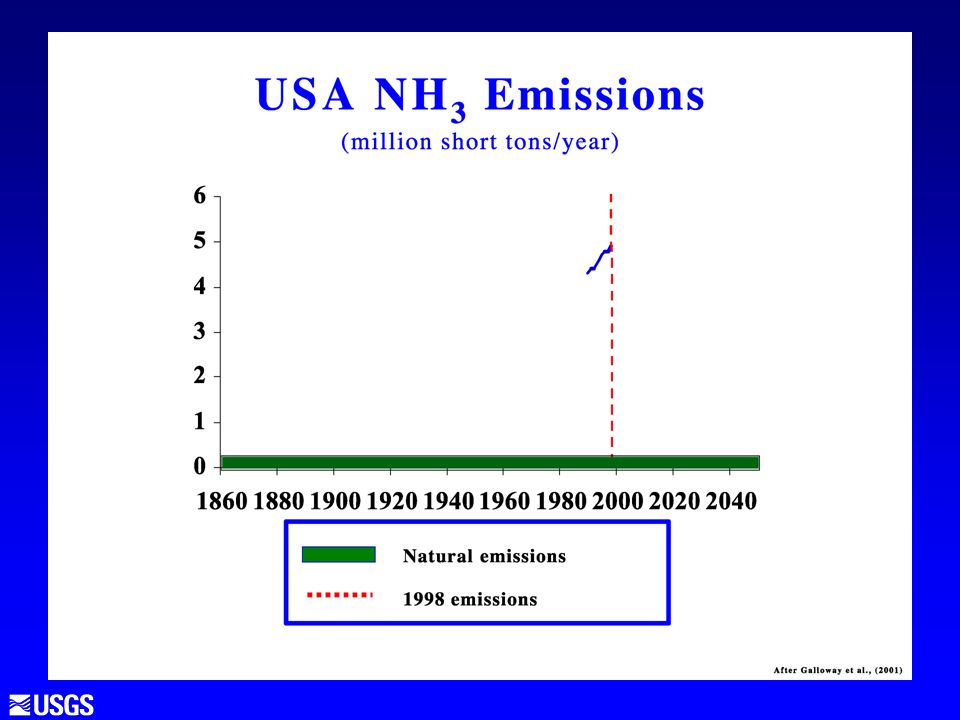
Total NH 3 emissions -- includes mobile and non-point sources

53
Ammonium Ion Concentrations 1985-2003 1985 19861984 National Atmospheric Deposition Program / National Trends Network

54
1986 19871985 Ammonium Ion Concentrations 1985-2003

55
1987 19881986 Ammonium Ion Concentrations 1985-2003

56
1988 19891987 Ammonium Ion Concentrations 1985-2003

57
1989 19901988 Ammonium Ion Concentrations 1985-2003

58
1990 19911989 Ammonium Ion Concentrations 1985-2003

59
1991 19921990 Ammonium Ion Concentrations 1985-2003

60
1992 19931991 Ammonium Ion Concentrations 1985-2003

61
1993 19941992 Ammonium Ion Concentrations 1985-2003

62
1994 19951993 Ammonium Ion Concentrations 1985-2003

63
1995 19961994 Ammonium Ion Concentrations 1985-2003

64
1996 19971995 Ammonium Ion Concentrations 1985-2003

65
1997 19981996 Ammonium Ion Concentrations 1985-2003

66
1998 19991997 Ammonium Ion Concentrations 1985-2003

67
1999 20001998 Ammonium Ion Concentrations 1985-2003

68
2000 20011999 Ammonium Ion Concentrations 1985-2003

69
2001 20022000 Ammonium Ion Concentrations 1985-2003

70
2002 20032001 Ammonium Ion Concentrations 1985-2003

71
2003 20042002 Ammonium Ion Concentrations 1985-2003

72
Ammonium Ion Concentrations 1985-2003 1985 19861984 National Atmospheric Deposition Program / National Trends Network

73
2003 20042002 Ammonium Ion Concentrations 1985-2003

74
Percent change in NH4+ in wetfall Lehmann et al., Environmental Pollution 2005

76
Annual VWM Inorganic N conc. in wetfall 10-year mean DIN concentration (NO 3 + NH 4 ) NADP sites in Colorado and Wyoming > 2400m elevationWyo.Zirkel SW Co. W Co. Front Range
 NADP sites in Colorado and Wyoming > 2400m elevationWyo.Zirkel SW Co. W Co. Front Range.")
77
- from NADP/NTN database NO 3 NH 4

78
Snowpack chemistry - G.P. Ingersoll and others, USGS Major ionsMajor ions NutrientsNutrients Trace metalsTrace metals 34 S, 15 N isotopes 34 S, 15 N isotopes

79
Nitrate in Rocky Mountain snowpack (average, 1993-2000) - G.P. Ingersoll and others, USGS
 - G.P. Ingersoll and others, USGS")
80
UT WY MT ID CO Taos SV. 0.020 Kg/ha/yr 0.032 Kg/ha/yr No trend UT WY MT ID CO Taos SV. No trend 0.0067 Kg/ha/yr 0.0064 Kg/ha/yr Regional deposition trends in Snowpack Chemistry, 1993-2004 - Ingersoll, in prep. NitrateAmmonium

82
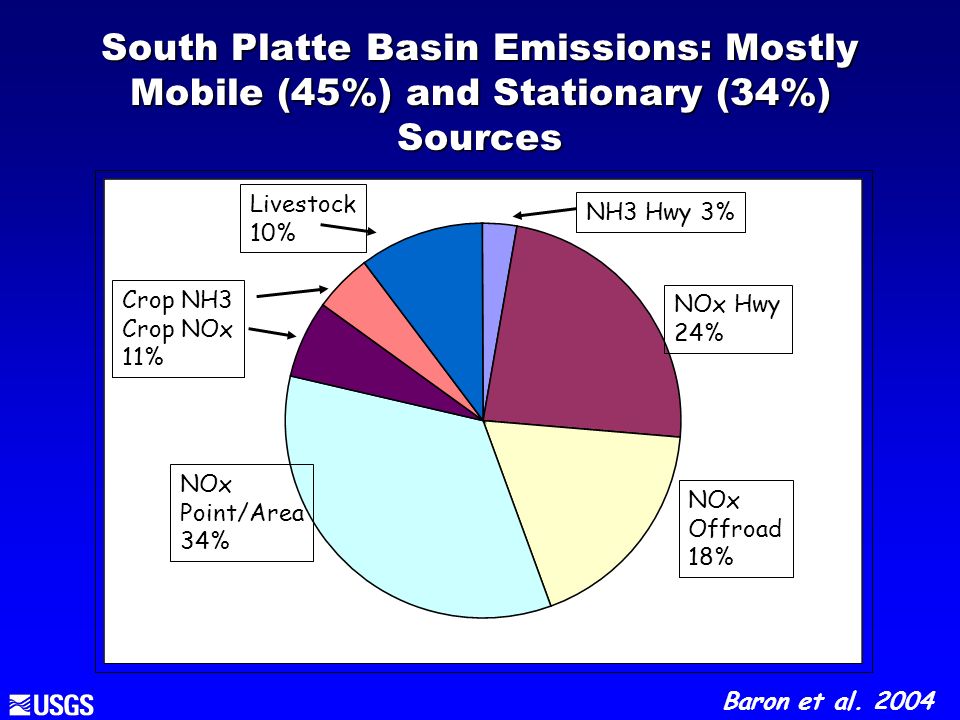
NOx Hwy 24% NH3 Hwy 3% NOx Offroad 18% NOx Point/Area 34% Crop NH3 Crop NOx 11% Livestock 10% South Platte Basin Emissions: Mostly Mobile (45%) and Stationary (34%) Sources Baron et al. 2004
83
Sources of nitrogen emissions in Colorado

84
NH 3 emissions from livestock in S. Platte basin are nearly 1000x greater than NH 3 emissions from wildlife in Rocky Mt. NP Baron, unpublished data

85
Source attribution using naturally occurring, stable isotopes of nitrogen compounds. Provide capability to distinguish between major source types of emissions. 15 N, 18 O, 17 O in NO 3 15 N in NH 4 + Recent advances in methodology expand possibilities. Campbell and Kendall, unpub. data Annual Snowpack Emily and Kendall, in prep.

86
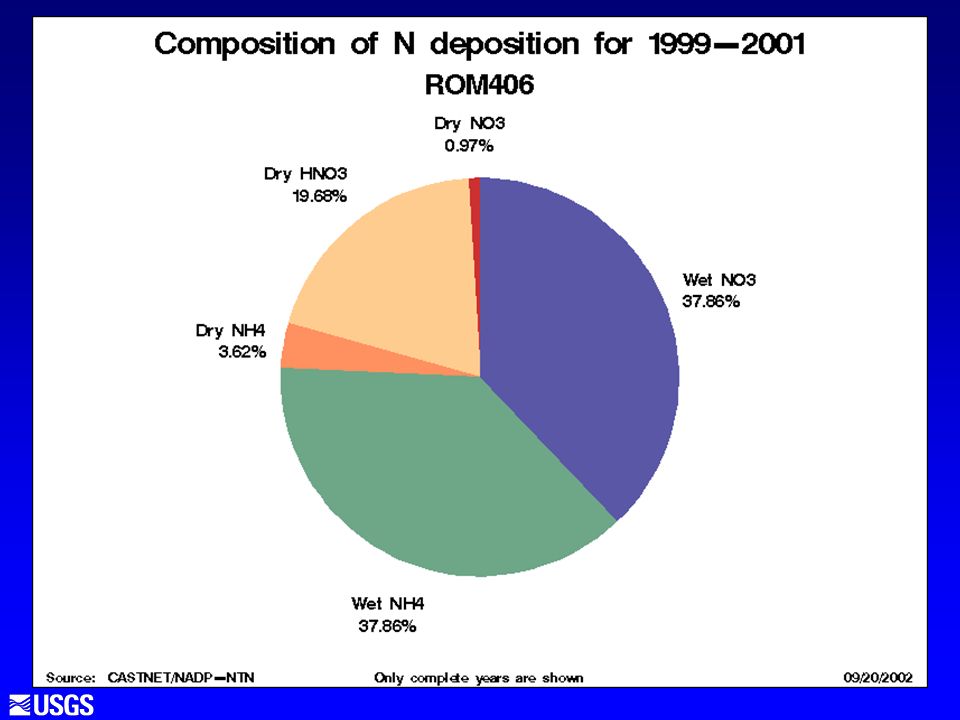
Nitrogen deposition in Rocky Overall nitrogen deposition is increasing. NO 3 (combustion sources) makes up >50%. NH 4 (agricultural sources) is increasing rapidly. Local and regional sources contribute to both. Local sources may contribute more during spring and summer. Next steps? - Integrated modeling and monitoring studies of air quality + deposition, incorporating natural tracers to identify source categories.
 makes up >50%. NH 4 (agricultural sources) is increasing rapidly. Local and regional sources contribute to both. Local sources may contribute more during spring and summer. Next steps. - Integrated modeling and monitoring studies of air quality + deposition, incorporating natural tracers to identify source categories..")
Similar presentations


 is an element like carbon. All creatures need nitrogen to survive. There are huge amounts of nitrogen gas in the atmosphere,>")


