Download presentation
Presentation is loading. Please wait.

1
Understanding Intended and Unintended Variation Andrew Wray – June 17, 2013

2
What are the 4 components of the theory of profound knowledge?

4
Rate of back surgery

5
Supply sensitive condition

6
Variation is not limited to utilization All dimensions of quality have the potential for variability – clinical outcomes, efficiency, etc. Also applies at the level of individuals

7
Dr. Kishore Visvanathan

8
Understanding Variation Walter Shewhart (1891 – 1967) W. Edwards Deming (1900 - 1993 ) The Pioneers of Understanding Variation
 The Pioneers of Understanding Variation.")
9
Intended and Unintended Variation Intended variation is an important part of effective, patient- centered health care. Unintended variation is due to changes introduced into healthcare process that are not purposeful, planned or guided. Walter Shewhart focused his work on this unintended variation. He found that reducing unintended variation in a process usually resulted in improved outcomes and lower costs. (Berwick 1991) Health Care Data Guide, p. 107
 Health Care Data Guide, p")
10
a) Describe an example of intended variation in your project. b) Describe an example of unintended variation in your project. Table Exercise:
 Describe an example of unintended variation in your project. Table Exercise:.")
11
Understanding Variation: the good and bad Unintended: – Poor research – Professional uncertainty – Poor knowledge – professional ignorance Intended: – Clinical differences among patients – Personal differences among patients

12
Most work of improvement is focused on unintended variation If all variation was unintended, it would be easy to stop. What is difficult is reducing unintended variation while keeping intended variation Unintended Variation

13
Reducing Unintended Variation

14
Shifting Performance

15
Re-discovery? Tonsillectomy – 10 fold variability Risk of death with surgical treatment – 8 fold variability

16
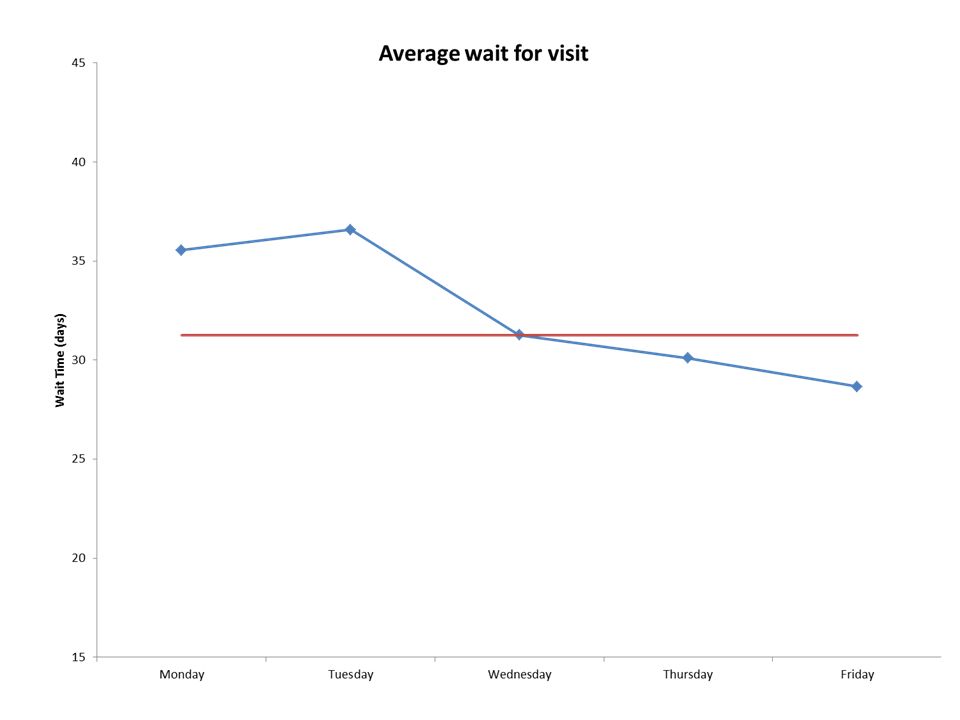
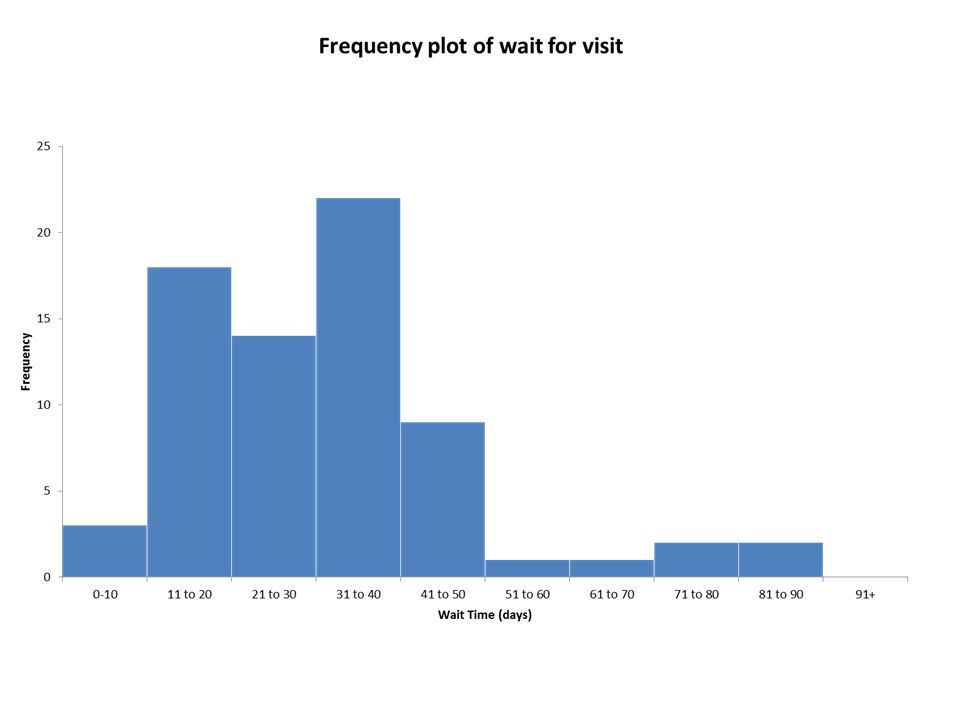
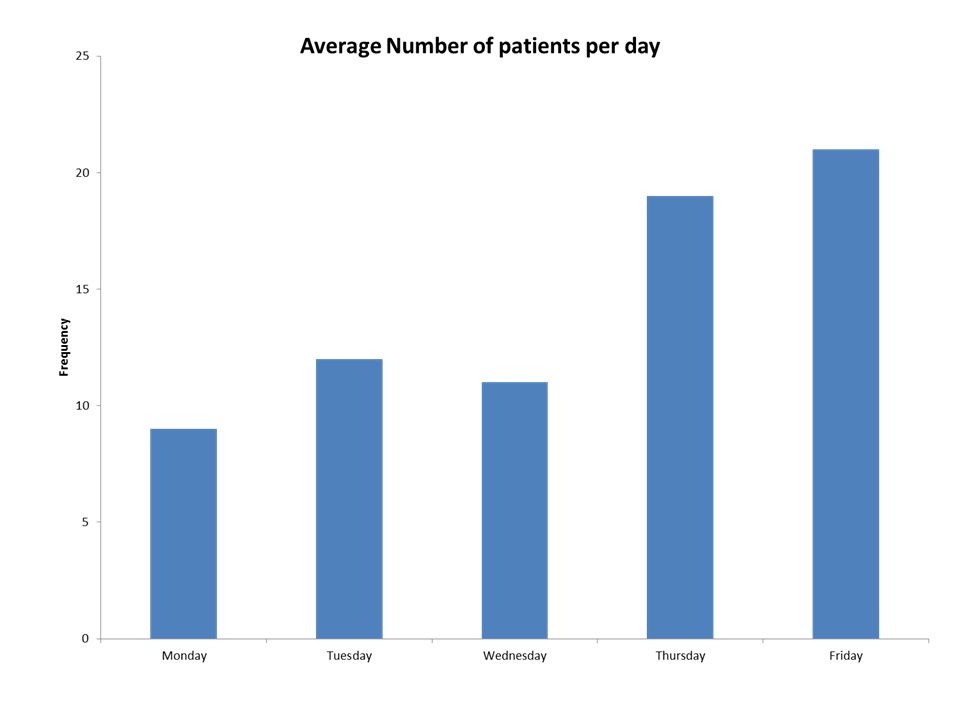
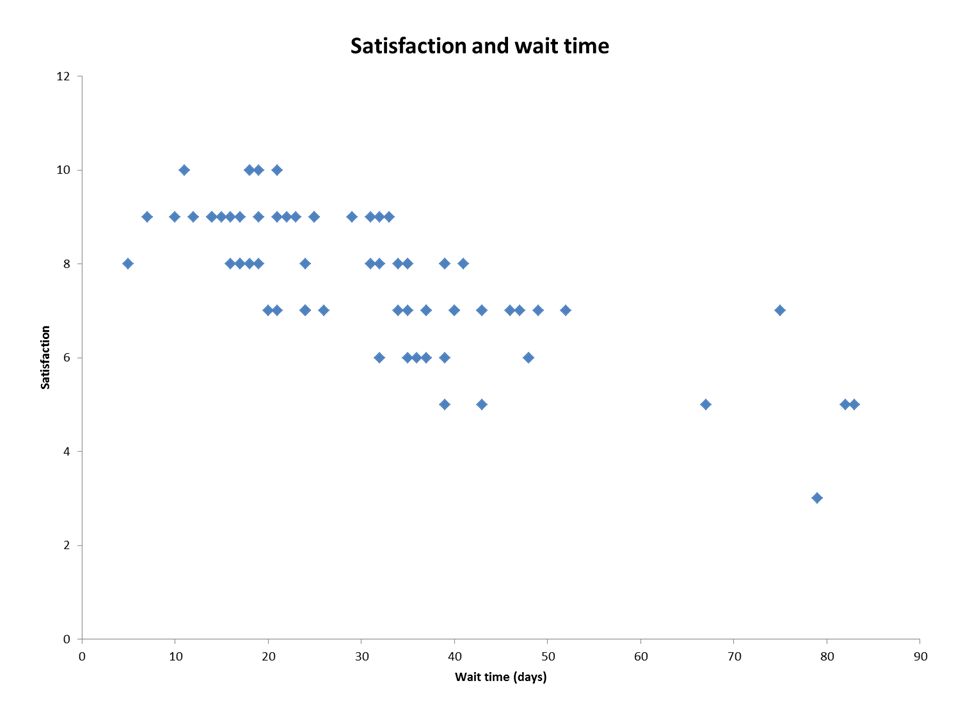
FREQUENCY PLOT PARETO CHART SCATTER PLOT Health Care Data Guide, p. 65 Tools to Learn from Variation in Data RUN CHART SHEWHART CHART

Similar presentations


 By Zaipul Anwar Business & Advanced Technology Centre, Universiti Teknologi Malaysia.>")

 Minds.>")


