Download presentation
Presentation is loading. Please wait.

1
Copyright © 2005 Pearson Education, Inc. publishing as Benjamin Cummings Catabolic Pathways and Production of ATP C 6 H 12 O 6 + 6O 2 6CO 2 + 6H 2 O + Energy (ATP + heat)
.")
2
NAD + Nicotinamide (oxidized form) Dehydrogenase 2 e – + 2 H + 2 e – + H + NADH H+H+ H+H+ Nicotinamide (reduced form) + 2[H] (from food) +
![NAD + Nicotinamide (oxidized form) Dehydrogenase 2 e – + 2 H + 2 e – + H + NADH H+H+ H+H+ Nicotinamide (reduced form) + 2[H] (from food) +](http://images.slideplayer.com/33/8259878/slides/slide_2.jpg "NAD + Nicotinamide (oxidized form) Dehydrogenase 2 e – + 2 H + 2 e – + H + NADH H+H+ H+H+ Nicotinamide (reduced form) + 2[H] (from food) +")
3
Copyright © 2005 Pearson Education, Inc. publishing as Benjamin Cummings NADH passes the electrons to the electron transport chain Unlike an uncontrolled reaction, the electron transport chain passes electrons in a series of steps instead of one explosive reaction Oxygen pulls electrons down the chain in an energy-yielding tumble The energy yielded is used to regenerate ATP

4
2 H + + 2 e – 2 H (from food via NADH) Controlled release of energy for synthesis of ATP 2 H + 2 e – H2OH2O + 1 / 2 O 2 H2H2 + H2OH2O Explosive release of heat and light energy Cellular respiration Uncontrolled reaction Free energy, G Electron transport chain
 Controlled release of energy for synthesis of ATP 2 H + 2 e – H2OH2O + 1 / 2 O 2 H2H2 + H2OH2O Explosive release of heat and light energy Cellular respiration Uncontrolled reaction Free energy, G Electron transport chain")
5
Mitochondrion Glycolysis Pyruvate Glucose Cytosol ATP Substrate-level phosphorylation ATP Substrate-level phosphorylation Citric acid cycle ATP Oxidative phosphorylation Oxidative phosphorylation: electron transport and chemiosmosis Electrons carried via NADH Electrons carried via NADH and FADH 2

6
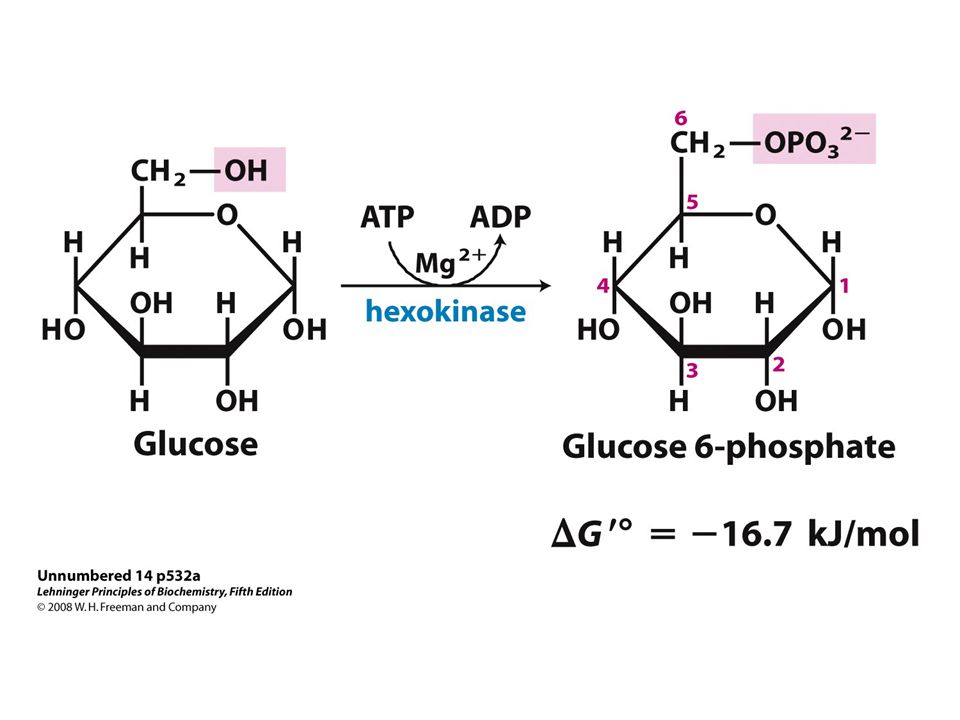
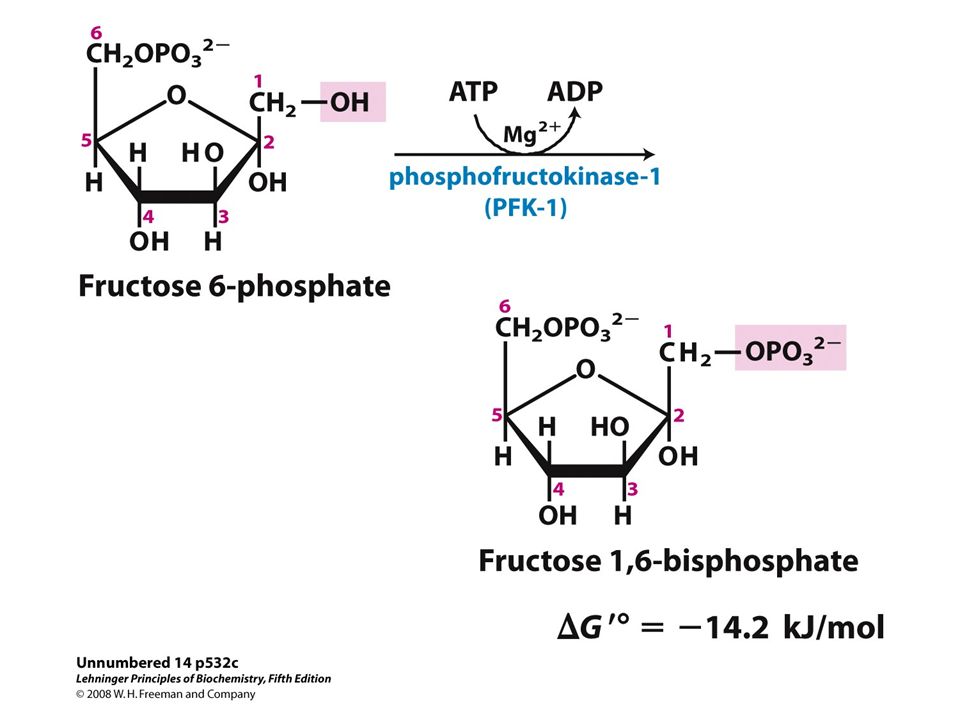
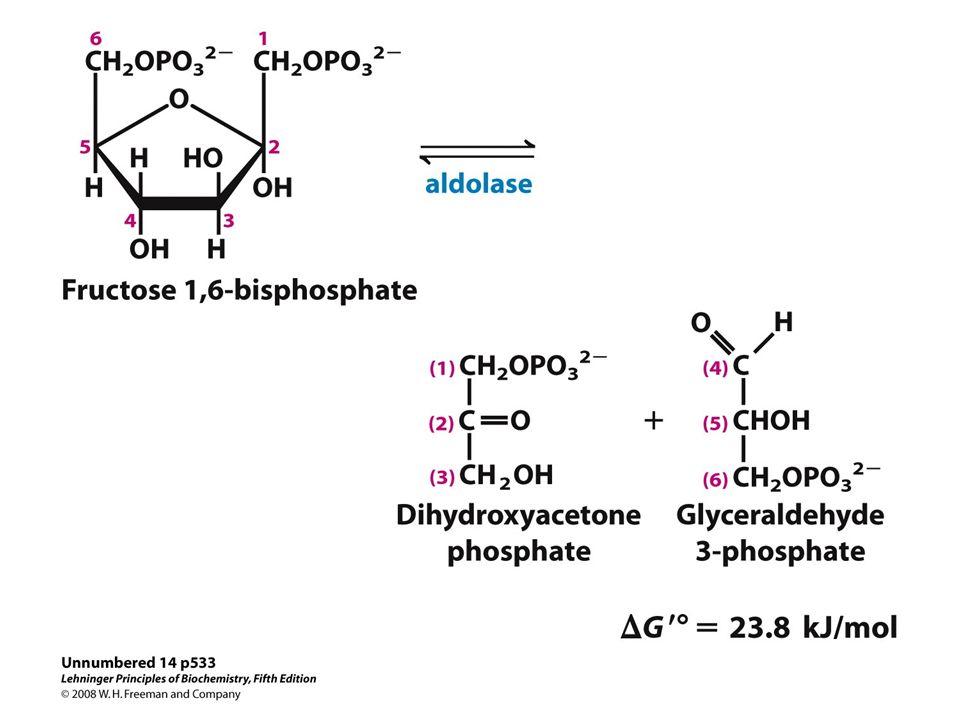
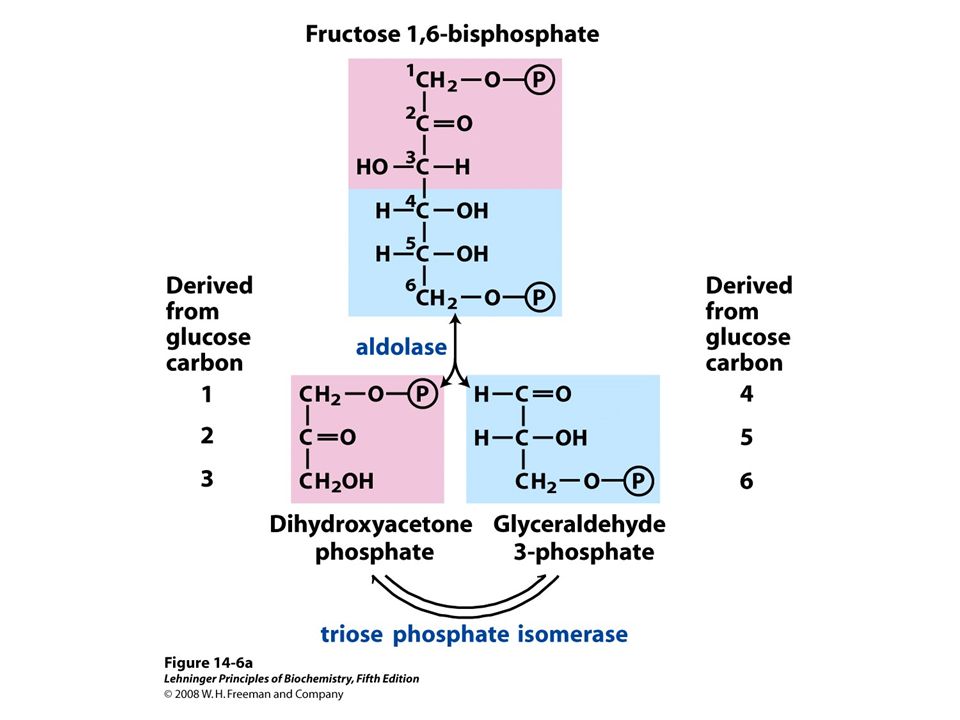
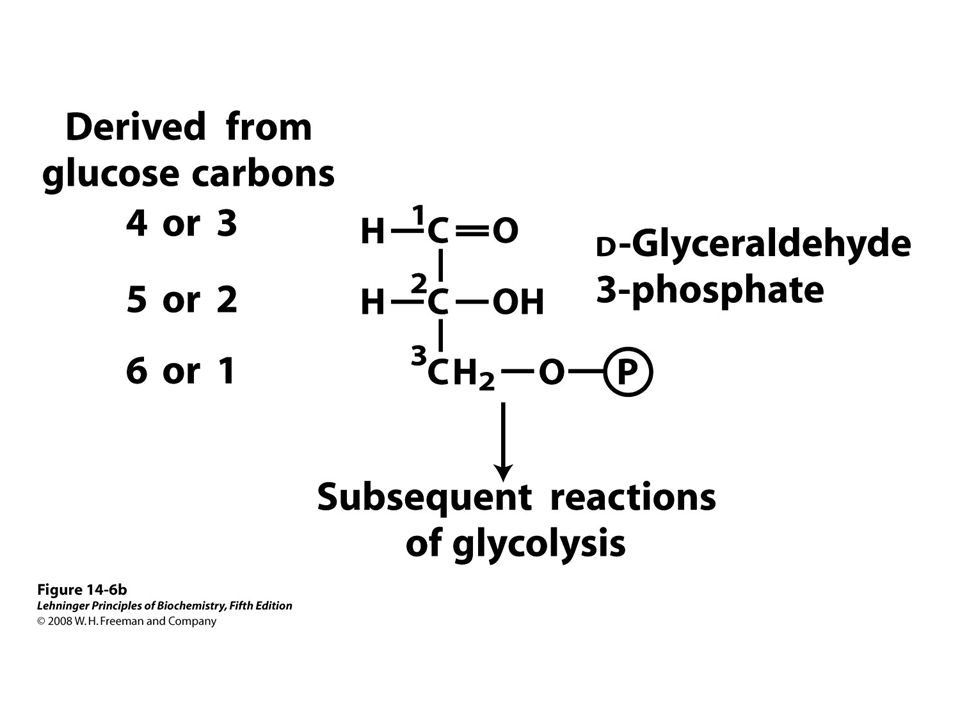
Copyright © 2005 Pearson Education, Inc. publishing as Benjamin Cummings 1. Glycolysis harvests energy by oxidizing glucose to pyruvate Glycolysis (“splitting of sugar”) breaks down glucose into two molecules of pyruvate Glycolysis occurs in the cytoplasm and has two major phases: – Energy investment phase – Energy payoff phase Animation: Glycolysis Animation: Glycolysis
 breaks down glucose into two molecules of pyruvate Glycolysis occurs in the cytoplasm and has two major phases: – Energy investment phase – Energy payoff phase Animation: Glycolysis Animation: Glycolysis.")
15
Copyright © 2005 Pearson Education, Inc. publishing as Benjamin Cummings

26
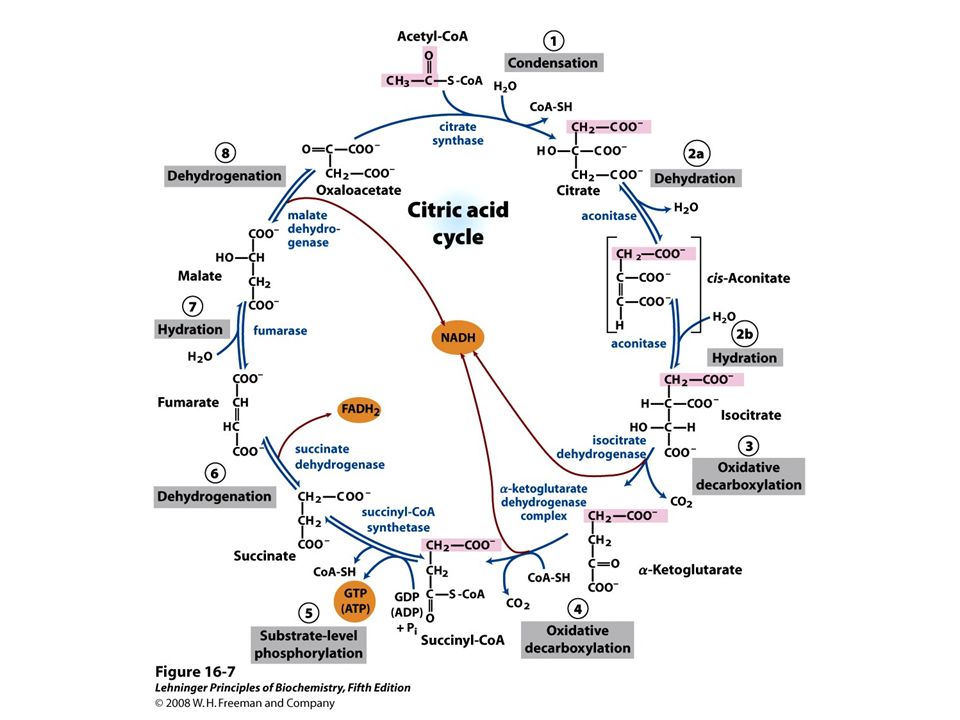
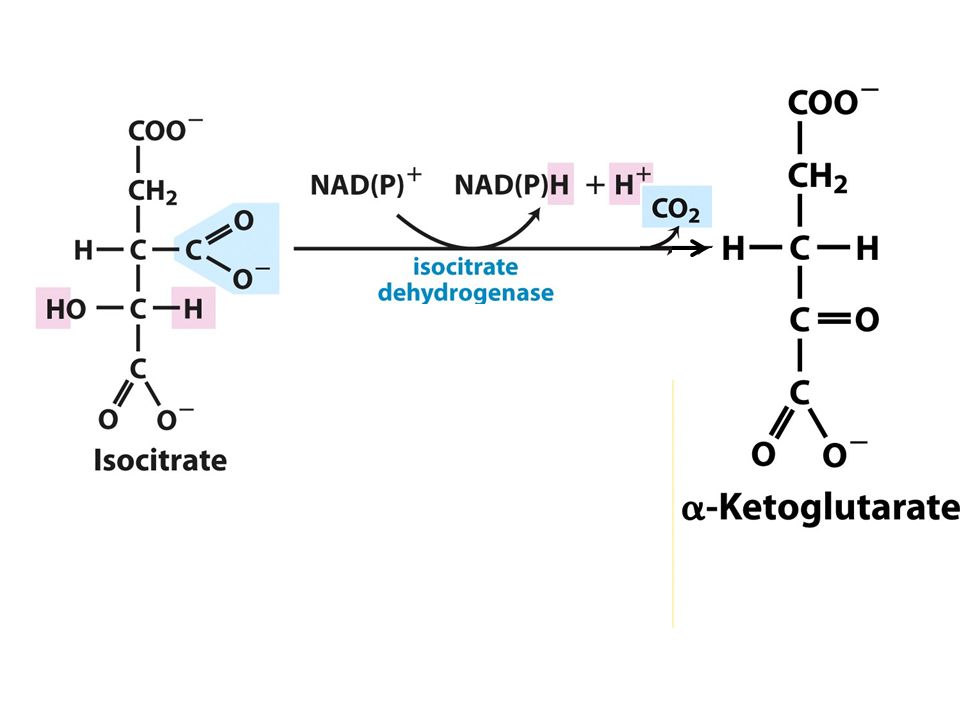
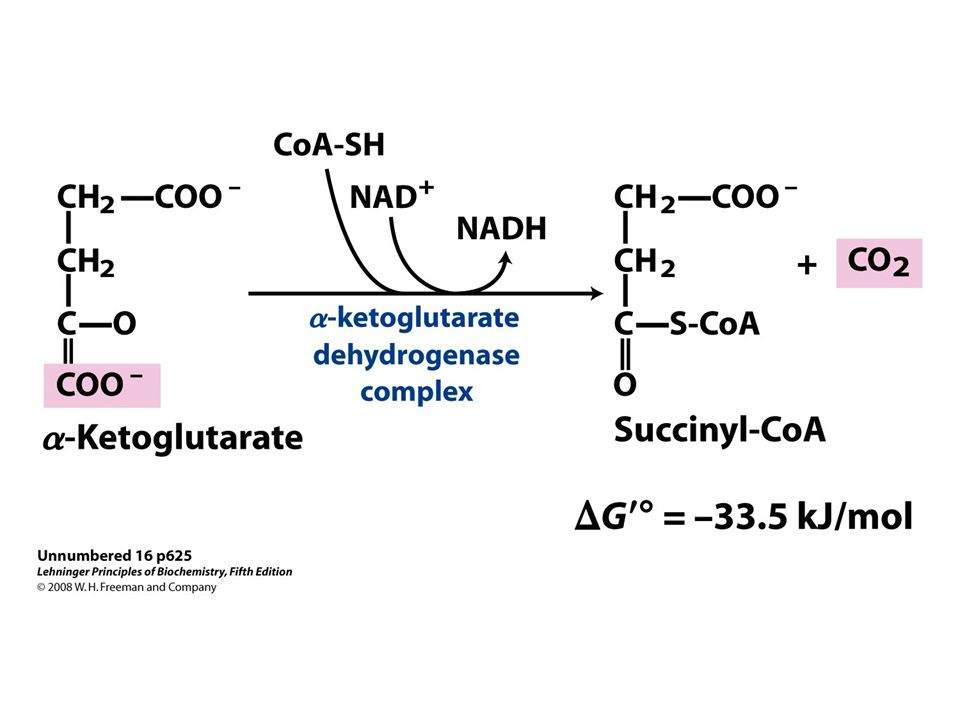
2. The citric acid cycle completes the energy- yielding oxidation of organic molecules Before the citric acid cycle can begin, pyruvate must be converted to acetyl CoA, which links the cycle to glycolysis

27
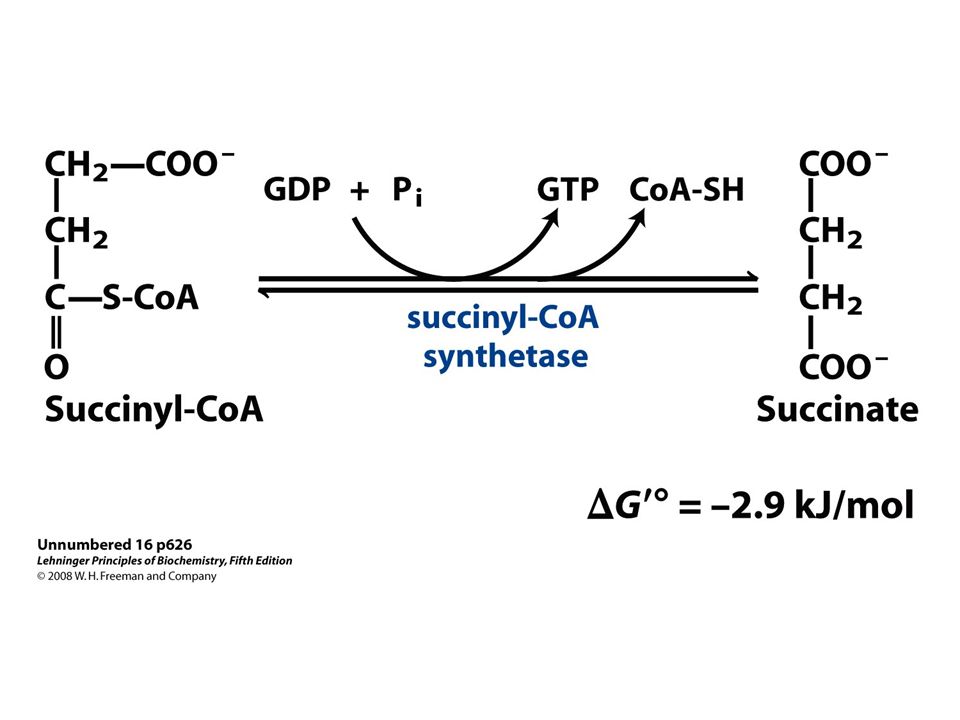
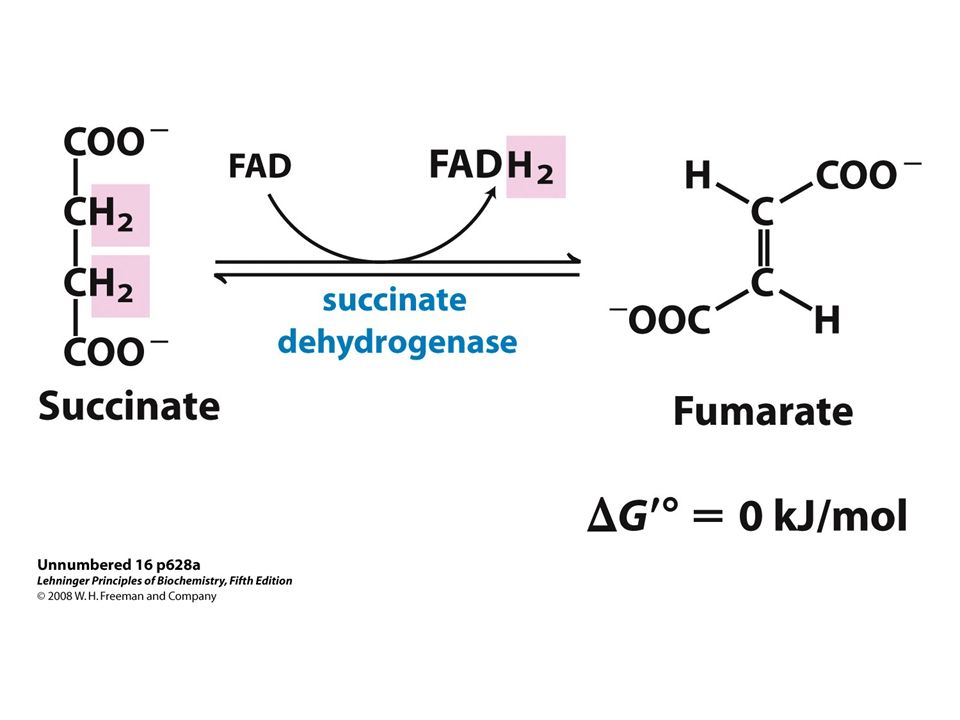
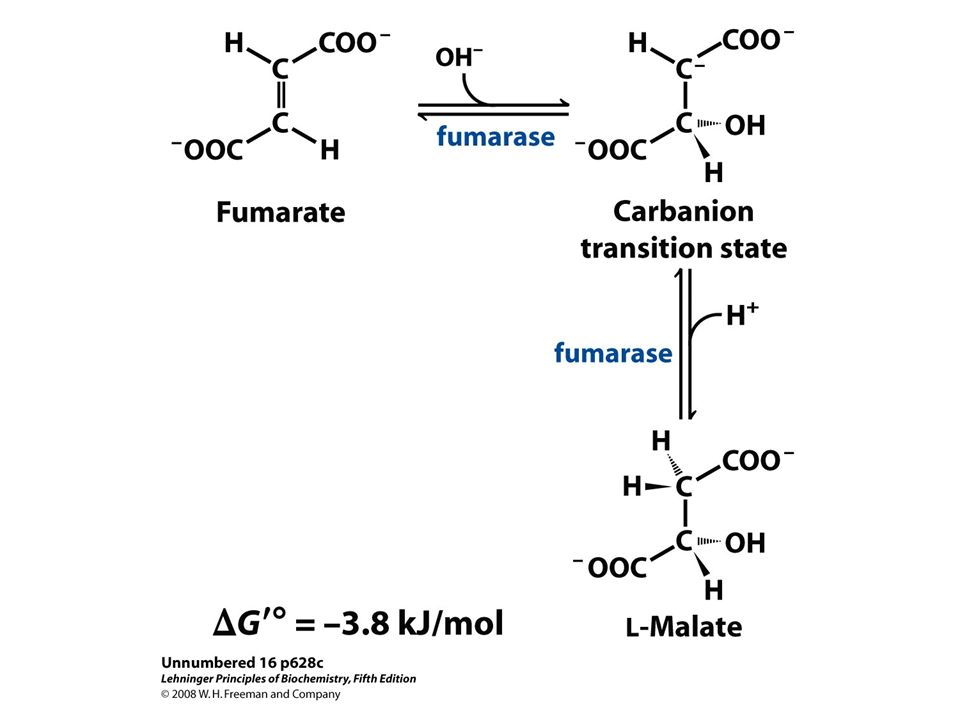
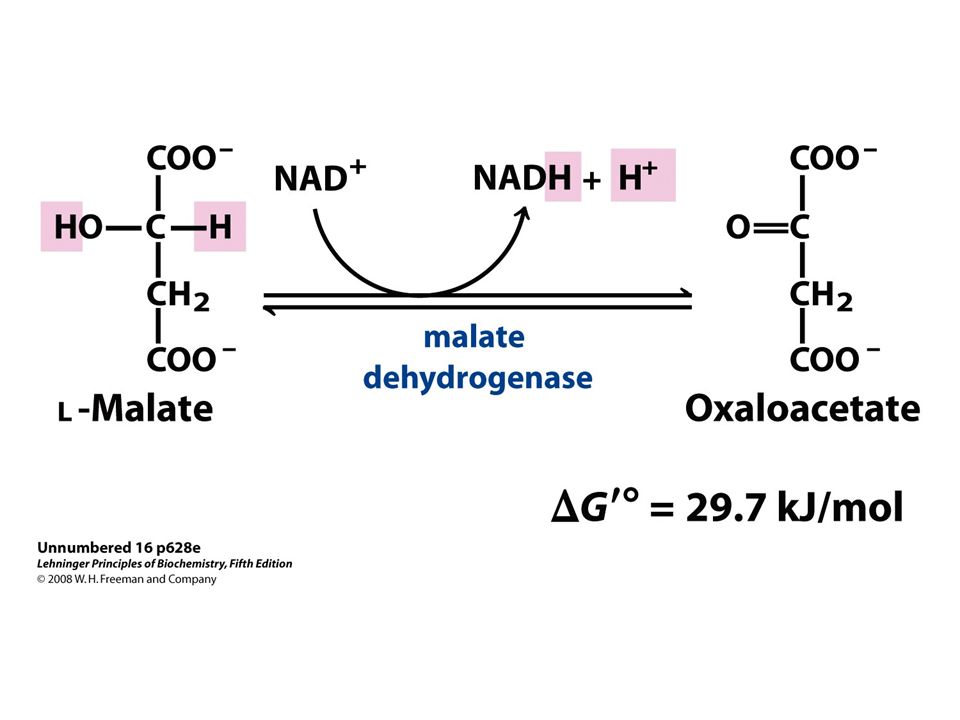
Copyright © 2005 Pearson Education, Inc. publishing as Benjamin Cummings The citric acid cycle, also called the Krebs cycle, takes place within the mitochondrial matrix The cycle oxidizes organic fuel derived from pyruvate, generating one ATP, 3 NADH, and 1 FADH 2 per turn Animation: Electron Transport Animation: Electron Transport

29
LE 9-10 CYTOSOL Pyruvate NAD + MITOCHONDRION Transport protein NADH + H + Coenzyme ACO 2 Acetyl Co A

45
Copyright © 2005 Pearson Education, Inc. publishing as Benjamin Cummings 3. During oxidative phosphorylation, chemiosmosis couples electron transport to ATP synthesis Following glycolysis and the citric acid cycle, NADH and FADH 2 account for most of the energy extracted from food These two electron carriers donate electrons to the electron transport chain, which powers ATP synthesis via oxidative phosphorylation

46
Energy investment phase Glucose 2 ATP used 2 ADP + 2 P 4 ADP + 4 P 4 ATP formed 2 NAD + + 4 e – + 4 H + Energy payoff phase + 2 H + 2 NADH 2 Pyruvate + 2 H 2 O 2 ATP 2 NADH + 2 H + Glucose 4 ATP formed – 2 ATP used 2 NAD+ + 4 e – + 4 H + Net Glycolysis Citric acid cycle Oxidative phosphorylation ATP

47
Copyright © 2005 Pearson Education, Inc. publishing as Benjamin Cummings ATP Yield From Complete Oxidation of Glucose

48
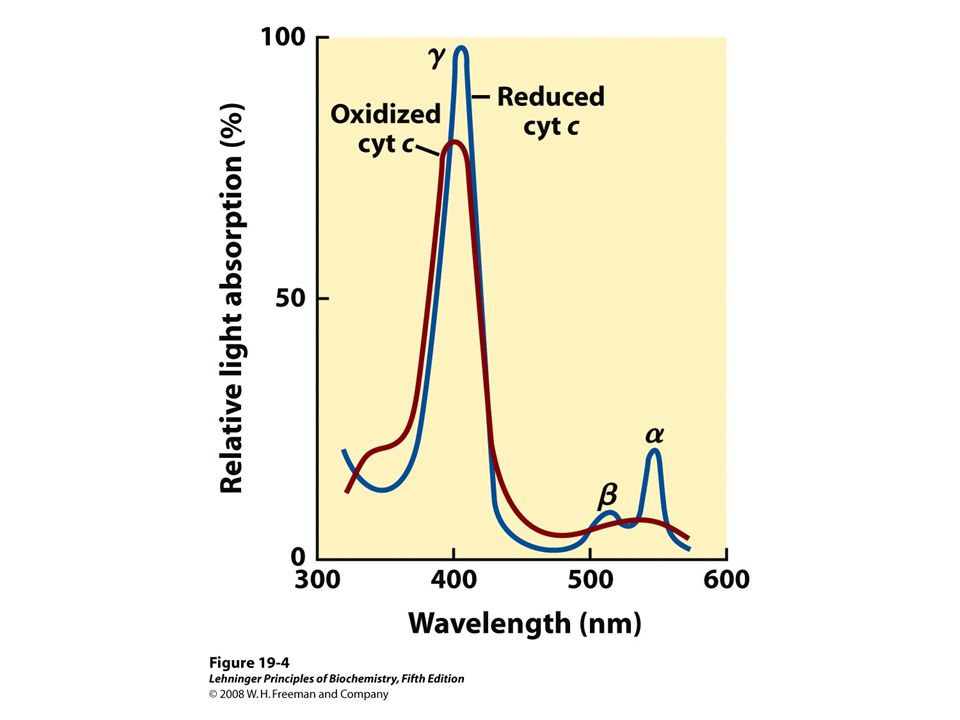
ATP Glycolysis Oxidative phosphorylation: electron transport and chemiosmosis Citric acid cycle NADH 50 FADH 2 40 FMN FeS I FAD FeS II III Q FeS Cyt b 30 20 Cyt c Cyt c 1 Cyt a Cyt a 3 IV 10 0 Multiprotein complexes Free energy (G) relative to O2 (kcal/mol) H2OH2O O2O2 2 H + + 1 / 2
 relative to O2 (kcal/mol) H2OH2O O2O2 2 H / 2")
57
Copyright © 2005 Pearson Education, Inc. publishing as Benjamin Cummings

64
The electron transport chain generates no ATP The chain’s function is to break the large free- energy drop from food to O 2 into smaller steps that release energy in manageable amounts

65
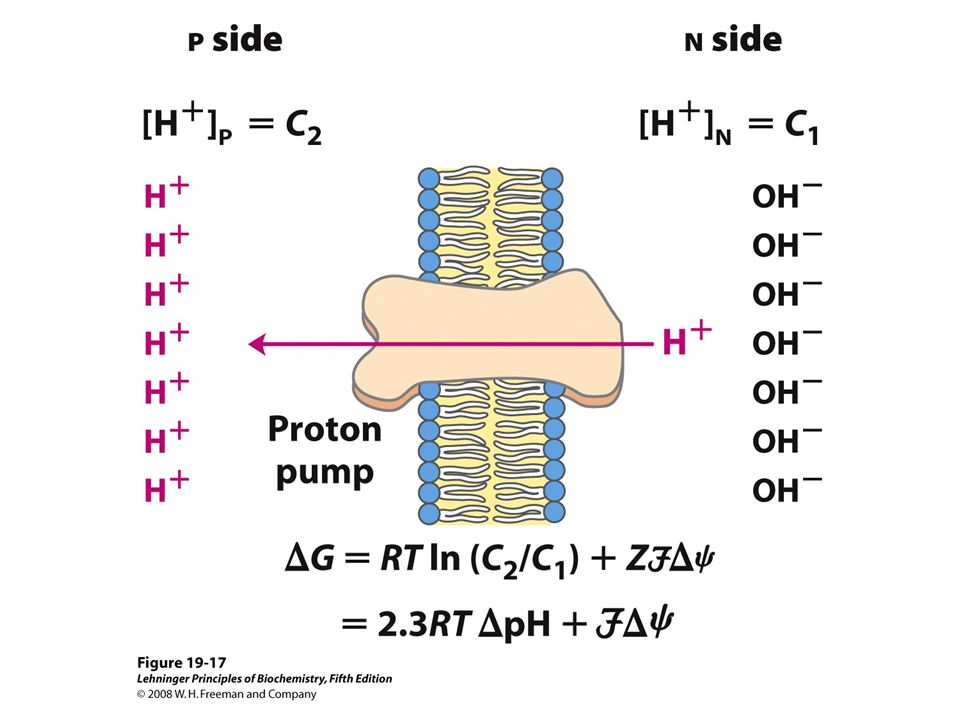
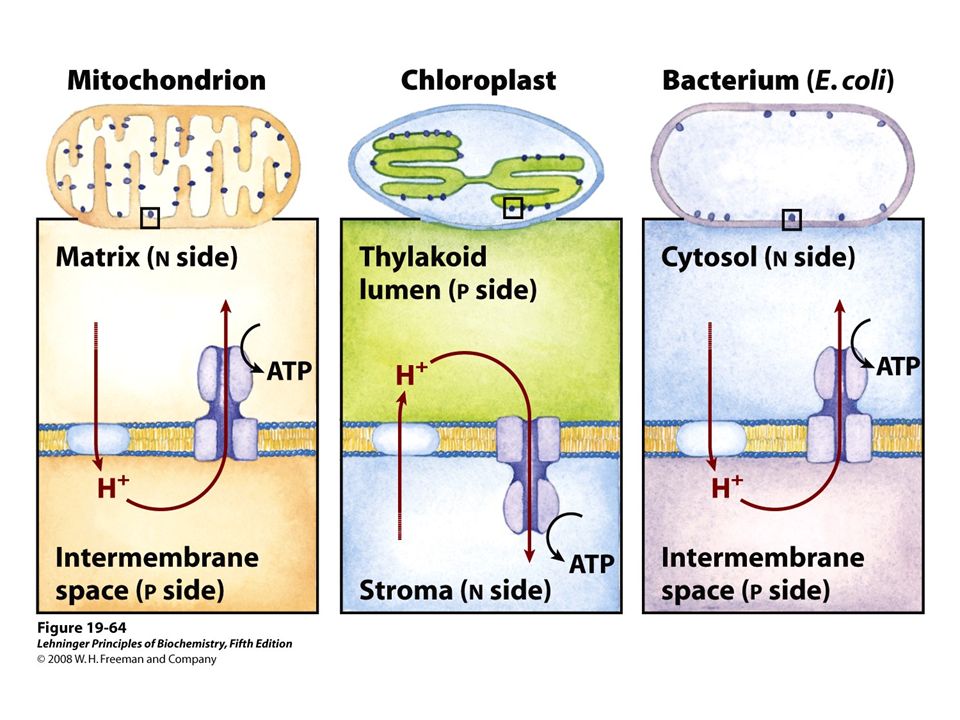
Copyright © 2005 Pearson Education, Inc. publishing as Benjamin Cummings The energy stored in a H + gradient across a membrane couples the redox reactions of the electron transport chain to ATP synthesis The H + gradient is referred to as a proton-motive force, emphasizing its capacity to do work Animation: Fermentation Overview Animation: Fermentation Overview

67
Citric acid cycle Oxidative phosphorylation Proteins NH 3 Amino acids Sugars Carbohydrates Glycolysis Glucose Glyceraldehyde-3- P Pyruvate Acetyl CoA Fatty acids Glycerol Fats

68
Major Metabolic Sites Liver Muscle, Nerve etc

69
Copyright © 2005 Pearson Education, Inc. publishing as Benjamin Cummings

Similar presentations


 Also, please get.>")