Download presentation
Presentation is loading. Please wait.

1
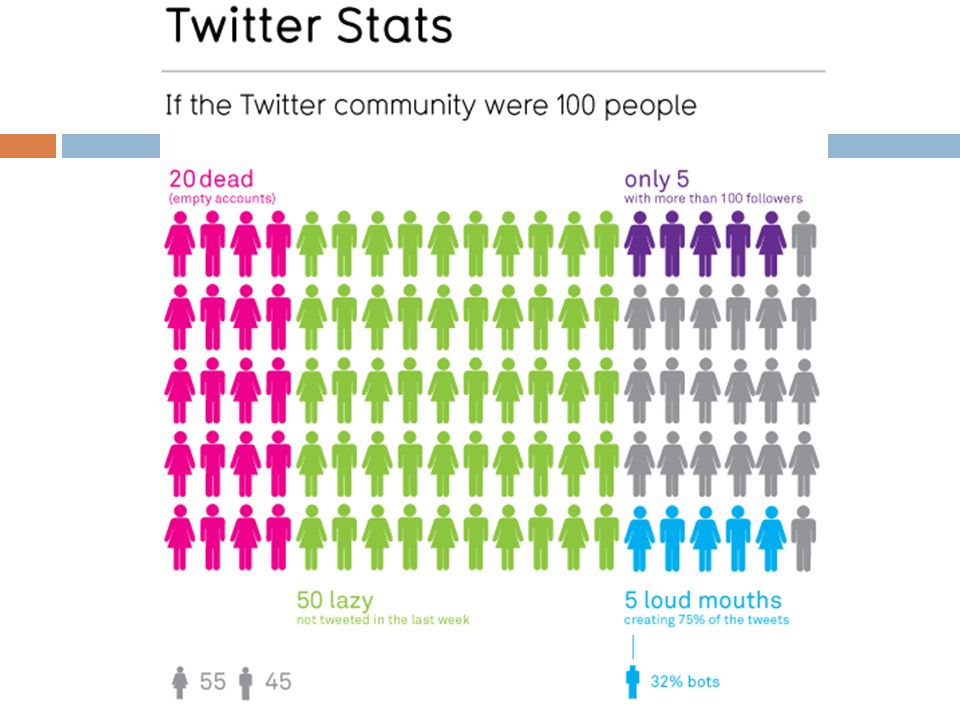
Interpreting Graphs Catalyst: When you see a graph what do you do to understand it? What was the statistic that shocked you the most from the achievement gap material? Write in complete sentences! Don’t talk during the Catalyst!

2
Objectives By the end of today, all SWBAT… Learn to take awesome science notes. Read and interpret various types of graphs.

3
Agenda How to take notes in a science class Graphing rap songs How to analyze graphs Stations Exit Question

4
Why Do We Take Notes? Taking notes helps us to learn Notes are a useful tool If you don’t remember an answer, and you have good notes, you can find the answer in your notes. When you review your notes, you get the big picture—how what you learn builds up over time and how it all fits together.

5
What Makes Good Notes Good? Good notes are written in your own words. Good notes only contain information that helps YOU understand the material. Good notes can be scanned quickly, so that you can easily find exactly what you’re looking for.

6
The Lim Yankowitz© Method Developed by world-famous scientist, Dr. Lim Yankowitz. Take a piece of paper, and fold the left side in toward the middle. The left side should be one-third the width of the paper. Write name of lesson and date on top.

7
Boxing1/14/10

8
Key Points All our lessons have 2-5 key points: the big, most important things that I want you to learn. In the left column of your paper, we will write key points. In PowerPoints, key points will always be bold red.

10
Boxing1/14/10 Key points go here!!!

11
Supporting Details Supporting details are everything that help you remember key points. On the other side of your paper, write down supporting details in your own words. YOU CHOOSE what to write down. Only write down what will help YOU remember the key points. Write supporting details in your own words. They’re only there to help YOU, so you need to make sure they’re in words YOU can understand.

12
Boxing1/14/10 Key point #1 Key point #2 Key point #3 Supporting details about key point #1. Supporting details about key point #2. Supporting details about key point #3.

13
Why Do We Do This? Immediately tell the difference between super important facts (key points) and the things that help you understand them (supporting details). Writing supporting details in your own words ensures that your notes are written in sentences that make sense to you. Easy to find facts. Find the key point that the fact is about,
 and the things that help you understand them (supporting details). Writing supporting details in your own words ensures that your notes are written in sentences that make sense to you. Easy to find facts. Find the key point that the fact is about,.")
14
Boxing1/14/09 Muhammad Ali was born “Cassius Clay” in 1942. He changed his name when he found religion in 1964, and joined the Nation of Islam. Few people know the name “Cassius Clay,” but almost everyone knows the name “Muhammad Ali.” He is widely regarded as the most famous, and greatest, fighter of all time. As an amateur boxer, Muhammad Ali won an olympic gold medal, though he later threw it into the Ohio River after being refused service at a “whites-only” restaurant. This was the first, but not the only, of Muhammad Ali’s political acts. As the heavyweight champion of the world, Ali chose to go to jail rather than fight in the Vietnam War. Ali famously said, “I ain’t got no quarrel with them Viet Cong… they never called me n*g**r.” Ali was later allowed to fight again, when the New York State Supreme Court ruled that he had been imprisoned unjustly. He immediately fought to reclaim his heavyweight title, but lost—the first of his professional career.

15
Boxing1/14/09 Boxing is a combat sport Boxing is the world’s oldest sport Two people fight for 12 rounds. Goal = knock opponent out. If no one is knocked out, whoever has the most points wins. There are 4 basic punches in boxing We’ve found 7000 year old drawings of boxing matches in Iraq. Became part of Olympics in 688 B.C. Jab = quick punch, front hand Cross = powerful punch, rear hand Hook = semi-circular punch Uppercut = vertical punch

21
Let’s practice those notes Key Point #1: When looking at a graph, try to put yourself in the scientist’s shoes: what was the question he/she was trying to answer? Think to yourself: Why did the author make this graph? What was he/she trying to show?

22
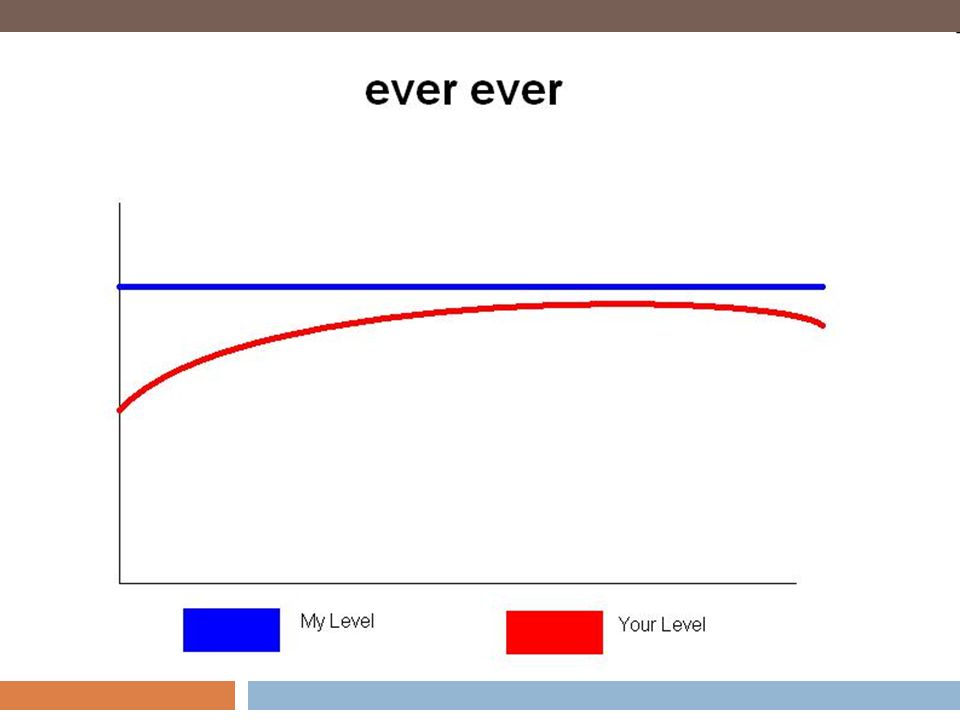
Let’s try this… Looking at this graph, what was the author trying to show in this graph?

23
Jump to conclusions Key Point #2: After determining the question, you should decide what conclusions can be made from the graph. What trends do you notice?

24
What conclusions can we make from this graph? Most of the recycling comes from 3 rd and 4 th graders. The least amount of the recycling comes from the 11 th graders. The 5 th and 6 th grades have different sections.

25
Always criticize! Key Point #3: Stay critical! When looking at graphs, figure out what future experiments should be done. No science is ever perfect. Why is the data the way it is? What is something more you want to know? How could you prove them wrong?

26
Criticize! What other things could they have asked?

27
TWPS What question is the scientist trying to answer? What conclusions can we make from this graph? What future experiment could be done?

28
Station time With your groups, you will rotate to each station with a cool, fresh graph. At each station you will have 5 minutes. The first 2 minutes, you will look at the graph silently and start answering the questions The last 4 minutes, you can talk with your group and help each other. Remember, if you slow down, the whole class slows down!

37
Exit Question What question is the scientist trying to answer? What conclusions can you make? What further experiment could be done? BONUS: Make your own hilarious graph of a song!

Similar presentations


![By: Morgan Craft Muhammad Ali [born Cassius Clay] was born January,17 th 1942 He is still alive nearing age 67.](/15/4658477/big_thumb.jpg "By: Morgan Craft Muhammad Ali [born Cassius Clay] was born January,17 th 1942 He is still alive nearing age 67.>")


