Download presentation
Presentation is loading. Please wait.

1
CBRFC Postmortem Analysis on June 2010 flooding in UT and CO

2
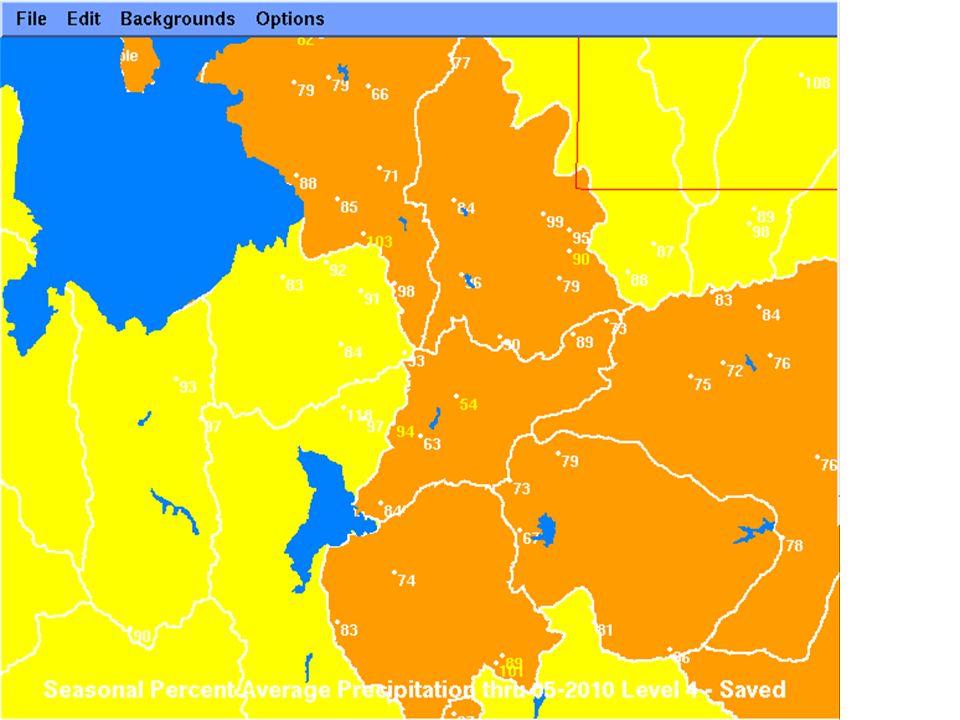
Post-Mortem for June 6-10 flooding Forecasts generally poor and under simulated for peak flows that occurred June 6-10, 2010 in northern Utah and western Colorado General conditions leading into event: – Near normal/below normal snowpack and precipitation on June 1 – Very cool May – Warm (but not record), moist air mass beginning June 5 – Temperature forecasts generally good – SNOTEL sites in flooding catchments near average for this time of year – Streamflow forecasts were almost uniformly too low What happened in the real world? What happened in the model world?

3
Temperature

4
Recent local Temperatures May was generally cool, delayed melt First week in June was warm From NOAA CPC A cool May A warm week

6
Snow

7
Snow: May 6 (above) June 4 (right)
 June 4 (right)")
10
Streamflow Forecasts

11
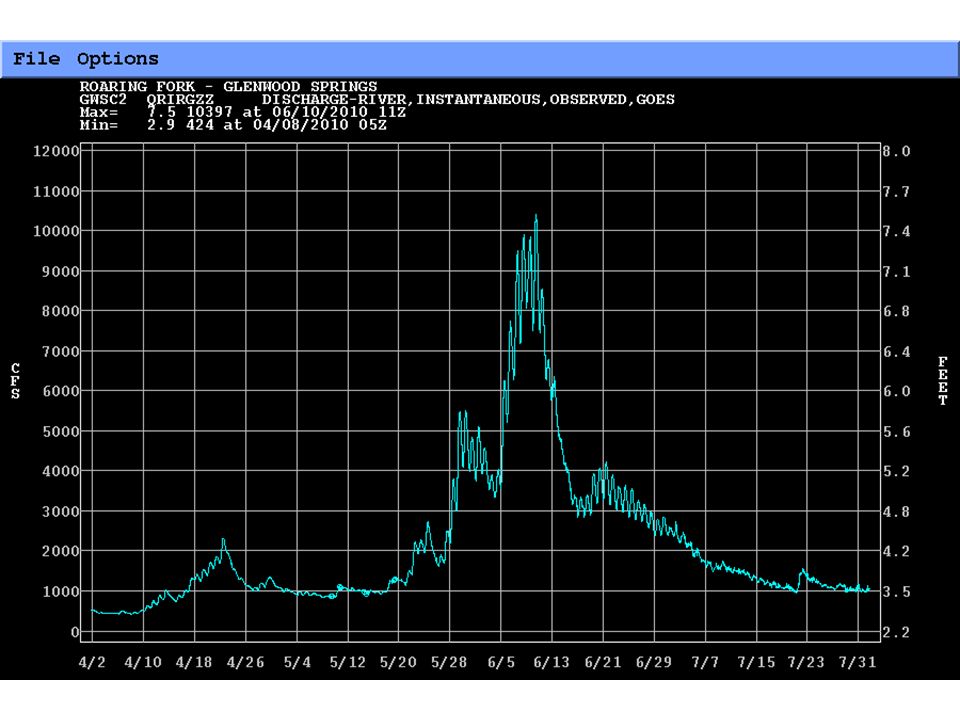
Observations Assumption that Peaks=f(snow volume) Season volumes affected somewhat Seen on: – Roaring Fork – Eagle – Uncompahgre (a little) – Granby (a little) – Yampa – Big/Little Cottonwood – Headwaters of Provo/Weber/Bear/Uinta streams Did not affect – Gunnison/San Juan Rivers – Blue – Upper Green
 Season volumes affected somewhat Seen on: – Roaring Fork – Eagle – Uncompahgre (a little) – Granby (a little) – Yampa – Big/Little Cottonwood – Headwaters of Provo/Weber/Bear/Uinta streams Did not affect – Gunnison/San Juan Rivers – Blue – Upper Green")
17
Streamflow Year Comparisons Both 2005 and 2006 had bigger snowpacks Flow peaks in prior years occurred after lower snow was gone In 2005 and 2006, imagine combining the two melt pulses into one – you’d get a flood! 2010 2005 2006 Rainfall

18
Little Cottonwood at Crestwood Park flow forecasts under-simulated forecasts observed simulated bankfull flood weekend

19
WFO Watches and warnings for Little Cottonwood (Cottonwood, Crestwood Park hydrograph shown) Flood Warning 543 PM MDT SUN JUN 6 Hydrologic Outlook (ESF) 330 PM MST SAT JUN 5 “FLOODING IS NOT ANTICIPATED” Flood Watch 1132 AM MDT SUN JUN 6 weekend
 Flood Warning 543 PM MDT SUN JUN 6 Hydrologic Outlook (ESF) 330 PM MST SAT JUN 5 FLOODING IS NOT ANTICIPATED Flood Watch 1132 AM MDT SUN JUN 6 weekend")
20
Snotels in Cottonwoods Mill-D North (8960’, southwest face) – “middle” Brighton (8750’, southeast face) – “middle” Snowbird (9640’, northeast face) – “high” Snowbird Mill-D North Brighton
 – middle Brighton (8750’, southeast face) – middle Snowbird (9640’, northeast face) – high Snowbird Mill-D North Brighton")
21
SWE in Cottonwoods Nearly identical melt! 2006 2010 Snowmelt rate extraordinarily large? (no) Snowmelt extraordinarily late? (no)
 Snowmelt extraordinarily late. (no).")
22
Snow Distribution – corroborates presence of lower elevation snow in 2010 at start of event 2006 Snowbird SNOTEL trace almost identical to 2010 trace from June 1-10 However, NOHRSC indicates south facing slopes had already melted out in 2006 2010 June 1 2006 June 1, for comparison

23
SWE melt comparison Compared to 2005 and 2006: 2010 had less SWE, but melt was more synchronized 2010 20052006 Lower vs upper meltout 20 days 30 days 5 days

24
Little Cottonwood at Crestwood Park: Temp. forecasts forecasts observed Averaged over all elevation zones: not bad! weekend

25
SWE/Snotel Comparison June Snowmelt at Snowbird in 2006 & 2010 were similar, but in 2006, snow at lower elevations was gone – in 2010 there was synchronized, rapid melt at both elevations. What about May 2006, when both zones were also melting? Melt rates were lower, particularly in upper zone (and flow response was smaller). 2010 ~1.8 in/day ~2 in/day ~1.5 in/day 2.5 to 3 in/day 2006
 ~1.8 in/day ~2 in/day ~1.5 in/day 2.5 to 3 in/day")
26
What did the model think? Model SWE at time of runoff was sufficient, and melt rates were close to observed rates Overall shape of seasonal snowpack was good (compare to ~38’ peak at Snowbird) 2.8 in/day 2.6 in/day Jun 3-8
 2.8 in/day 2.6 in/day Jun 3-8.")
27
What did the model think? Model soil was on pretty dry in upper and middle levels entering event, and stored water Deficits in model soil filling Jun 3-8 3-4 days melt soaked up upper lower middle

28
Was the model right about soil moisture? Partly right – 2010 was relatively dry Partly wrong – throughout winter, SM steadily moved upward toward normal levels In model, this recovery started late and didn’t get as far 3-4 days of melt went by before model really started generating runoff

29
SWE related mods? LCTU1 (Cottonwood @ SLC) only melt factor was used MFC 0.69 CFS MFC 1.70 MFC 1.80 – deleted 6/7 MFC 2.35 – deleted 6/8, 6/10 MFC 1.47 – deleted 6/9 Note, appears we did only one soil water mod during May-June
 only melt factor was used MFC 0.69 CFS MFC 1.70 MFC 1.80 – deleted 6/7 MFC 2.35 – deleted 6/8, 6/10 MFC 1.47 – deleted 6/9 Note, appears we did only one soil water mod during May-June.")
30
Preliminary Thoughts (circa June 2010) The snowmelt that drove the flooding was … More rapid than normal From more area than normal (both middle and high elevations; also south facing and north facing at the same time) The cool May 2010 … Delayed the melt of snow into June, holding lower elevation snow Atmospheric moisture effects contributed little during the event, but prior month of cool, relatively moist conditions may have helped it ripen CBRFC models under-simulated the streamflow response
 The snowmelt that drove the flooding was … More rapid than normal From more area than normal (both middle and high elevations; also south facing and north facing at the same time) The cool May 2010 … Delayed the melt of snow into June, holding lower elevation snow Atmospheric moisture effects contributed little during the event, but prior month of cool, relatively moist conditions may have helped it ripen CBRFC models under-simulated the streamflow response")
31
Questions Hypothesis #1: Existing model infrastructure not sufficient to capture this event. H1A: Mismatch between real time and calibration precipitation and temperature input? H1B: Insufficient model spatial distribution? E.g. Model differentiates elevation but not aspect. H1C: Insufficient physics in (temperature index) snow model? Hypothesis #2: Existing observational infrastructure not sufficiently distributed in space to capture this event. Tested by extending calibration dataset for Weber Basin through 2010 (Craig) Result: did not significantly alter streamflow simuation Tested by expanding number of “zones” in Weber Basin model to reflect aspect (Craig) Result: Improved simulation somewhat but not dramatically
 snow model. Hypothesis #2: Existing observational infrastructure not sufficiently distributed in space to capture this event. Tested by extending calibration dataset for Weber Basin through 2010 (Craig) Result: did not significantly alter streamflow simuation Tested by expanding number of zones in Weber Basin model to reflect aspect (Craig) Result: Improved simulation somewhat but not dramatically.")
32
Possible Reasons Possible Input errors Precipitation Temperature Fixes for the future However, running model in calibration mode showed similar errors Show results Known Snow-17 errors in anomalous situations Temperature index model Melt of snow probably was atypical Diurnal amplitude/SCE tells us something Model is split by elevation zones not aspect Significant melt in May in exposed areas Delay of melt in colder, less exposed areas North facing lower level melted at same time as south facing high level? Preliminary re-calibration results not much help Added more zones Made sac-sma more responsive Similar errors in other years

33
Areas of Study Areal Extent updates Incorporate Snow Cover Extent into model Improvements to the Snow model Pursue alternatives to SNOW-17 Distributed models Finer scale modeling may be the only answer Late melt = flooding potential

Similar presentations