Download presentation
Presentation is loading. Please wait.

1
Questions from reading material What are Houle et al’s 10 “commandments” and why are they important? How would you help McKinney (1997) improve on Figure 2? (and hence the inferences he draws from them? Assignment*Which commandments did Sepkoski (1984) break, do you think his inferences hold (if so, to what extent)?
 improve on Figure 2. (and hence the inferences he draws from them. Assignment*Which commandments did Sepkoski (1984) break, do you think his inferences hold (if so, to what extent) .")
2
10 commandments 1.Keep theoretical context in mind 2.Honour your family of hypotheses 3.Make meaningful definitions 4.Know what the numbers mean 5.Remember where the numbers come from 6.Respect scale type 7.Know the limits of your model 8.Never substitute a test for an estimate 9.Clothe estimates in the modest raiment of uncertainty 10.Never separate a number form its unit

3
McKinney 1997 "Extinction vulnerability and selectivity: Combining ecological and paleontological views." Annual Review of Ecology and Systematics 28: 495-516.

4
Extinction: When did a taxon become extinct? Statistical Paleobiology Remote lecture 9 Sep 2013 Oslo Helsinki

5
Outcrop

6
Horizons

7
What do we know? How confident are we? What are our assumptions ?

9
Assessing the Causes of Late Pleistocene Extinctions on the Continents Barnosky et al. Science 2004

10
Bradshaw, C. J. A., et al. (2012). "Robust estimates of extinction time in the geological record." Quaternary Science Reviews 33: 14-19.

12
Marshall, C. R. (1995). "Distinguishing between Sudden and Gradual Extinctions in the Fossil Record - Predicting the Position of the Cretaceous-Tertiary Iridium Anomaly Using the Ammonite Fossil Record on Seymour Island, Antarctica." Geology 23(8): 731-734.
:")
13
Why is it important to ‘know’ when a taxon became extinct? In its own right Helps to understand WHY it became extinct (or migrated in case of local extinction) Changes in extinction rates (multiple taxa) Understanding drivers of extinction Temporal correlation of strata
 Changes in extinction rates (multiple taxa) Understanding drivers of extinction Temporal correlation of strata.")
14
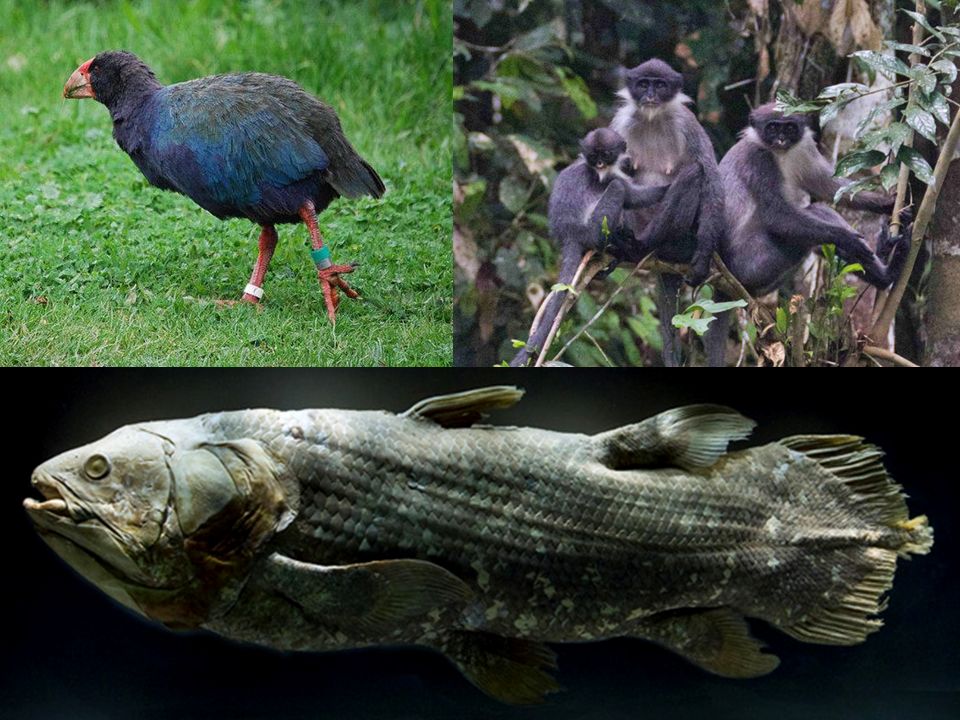
Assess hypotheses of extinction Baseline for incompleteness of fossil record Predict future fossil finds Predict which fossils species might be extant Assess phylogenetic hypotheses (and taxonomic assignments) Why is estimating confidence intervals important?
 Why is estimating confidence intervals important")
16
Set Refresher Not A Grey box: the events in which taxon A was alive and then dead and buried A Red circle: the events in which taxon A was sampled

19
Class exercise: There are two events A and B. A is the event where a fossil deer species is present and B is the event where its fossil predator is present. The union of A and B is 0.4 while P(A) and P(B) are 0.2 and 0.3 respectively. Find the following and say what they mean.
 and P(B) are 0.2 and 0.3 respectively. Find the following and say what they mean..")
20
Solution 0.1 0.2 0.6

21
Basic Probability Review Interactive Multimedia Course developed by Rice University, U of Houston Clear Lake and Tufs University http://onlinestatbook.com/ Probability lecture http://www.youtube.com/watch?v=F5TDpbPS y1w http://www.youtube.com/watch?v=F5TDpbPS y1w

22
Marshall 1990 (actually “anglicizing Sadler and Strauss older papers): Assuming random preservation/sampling
: Assuming random preservation/sampling")
23
Marshall 1990 Assuming random preservation/sampling Stratigraphic range is AWALYS shorter than TRUE duration (barring reworking)
")
24
Class exercise N=10 C=0.95 α=? Oldest sample =60 Ma Youngest sample =50Ma What is the range of true extinction? What is the range of true origination? What is the range of both (simultaneously?) R Marshall 1990 Assuming random preservation/sampling
 R Marshall 1990 Assuming random preservation/sampling.")
25
Testing assumptions Is fossilization random? (is sampling stochastically constant?) Are fossilization events independent? (multiple records taken as one) *Continuous sampling R Marshall 1990 Assuming random preservation/sampling
 Are fossilization events independent. (multiple records taken as one) *Continuous sampling R Marshall 1990 Assuming random preservation/sampling.")
26
Marshall, C. R. (1995). "Distinguishing between Sudden and Gradual Extinctions in the Fossil Record - Predicting the Position of the Cretaceous-Tertiary Iridium Anomaly Using the Ammonite Fossil Record on Seymour Island, Antarctica." Geology 23(8): 731-734.
:")
27
Strauss, D. and P. M. Sadler (1989). "Classical Confidence-Intervals and Bayesian Probability Estimates for Ends of Local Taxon Ranges." Mathematical Geology 21(4): 411-421. estimates of θ 1 and θ 2 and are y and z respectively but these are biased because P(Y< θ 1 )=1 P(Z> θ 2 )=1 (if time in MYA runs from bottom to top ) Doing nothing is a decision, doing something is better than doing nothing in this case Stratigraphic range is AWALYS shorter than TRUE duration (barring reworking)
: estimates of θ 1 and θ 2 and are y and z respectively but these are biased because P(Y< θ 1 )=1 P(Z> θ 2 )=1 (if time in MYA runs from bottom to top ) Doing nothing is a decision, doing something is better than doing nothing in this case Stratigraphic range is AWALYS shorter than TRUE duration (barring reworking).")
28
Non-random preservation/sampling 76543217654321 654321654321 1 24 8 12 Marshall 1994 Paleoiology Median = 4.5

29
Any gap has a 50% chance of being larger than the median The chance for all gaps to be larger than the median of the underlying distribution 0 0.5 6 =0.0156. That also means that the probability that the median gap lies within the range of those sampled is 1-0.0312 = 0.9688 Catch: CI’s have own uncertainties Marshall 1994 Paleoiology Assumes gap duration distribution free

30
Marshall 1994 Paleoiology Non-random preservation/sampling Confidence levels For N = 6 and for the statement, that a gap has a 50 % chance of being greater or smaller than the median, we have a 0.95 probability that the next gap is as small as the first smallest gap and or as large as the 6 th largest gap.

31
Cheetham, A. H. (1986). "Tempo of Evolution in a Neogene Bryozoan: Rates of Morphologic Change Within and Across Species Boundaries." Paleobiology 12(2): 190-202.
:")
32
Marshall 1994 Paleoiology

33
Solow, A. R. (2003). "Estimation of stratigraphic ranges when fossil finds are not randomly distributed." Paleobiology 29(2): 181-185. (Based on Robson and Whitlock 1964) R exercise
: (Based on Robson and Whitlock 1964) R exercise.")
34
Reasons for non randomness Sequence stratigraphic architectures Variation in paleo-environment Variation in quality of outcrop Taphonomic regimes Collecting practices Ocean circulation Biotic interactions (many more reasons for global non-randomness)
")
36
Marshall, C. R. (1997). "Confidence intervals on stratigraphic ranges with nonrandom distributions of fossil horizons." Paleobiology 23(2): 165-173.
:")
37
Summary of single taxon extinction time estimation covered Assume uniform random sampling (Strauss and Sadler 1986, Marshall 1990) Distribution free gaps (Marshall 1994) Non-random distribution of fossil finds (Solow 2003) When the fossil recovery potential is known (Marshall 1997) If a paper doesn’t talk about assumptions, think about the implicit ones violating assumptions vs not measuring uncertainty at all
 Distribution free gaps (Marshall 1994) Non-random distribution of fossil finds (Solow 2003) When the fossil recovery potential is known (Marshall 1997) If a paper doesn’t talk about assumptions, think about the implicit ones violating assumptions vs not measuring uncertainty at all")
38
References READING: Marshall 2010 in Quantitative Paleobiology short course Strauss, D. and P. M. Sadler (1989). "Classical Confidence-Intervals and Bayesian Probability Estimates for Ends of Local Taxon Ranges." Mathematical Geology 21(4): 411-421. Marshall, C. R. (1990). "Confidence-intervals on stratigraphic ranges." Paleobiology 16(1): 1- 10. Marshall, C. R. (1994). "Confidence-intervals on stratigraphic ranges - partial relaxation of the assumption of randomly distributed fossil horizons." Paleobiology 20(4): 459-469. Marshall, C. R. (1997). "Confidence intervals on stratigraphic ranges with nonrandom distributions of fossil horizons." Paleobiology 23(2): 165-173. Weiss, R. E. and C. R. Marshall (1999). "The uncertainty in the true end point of a fossil's stratigraphic range when stratigraphic sections are sampled discretely." Mathematical Geology 31(4): 435-453. Solow, A. R. (2003). "Estimation of stratigraphic ranges when fossil finds are not randomly distributed." Paleobiology 29(2): 181-185. Bradshaw, C. J. A., et al. (2012). "Robust estimates of extinction time in the geological record." Quaternary Science Reviews 33: 14-19.
. Classical Confidence-Intervals and Bayesian Probability Estimates for Ends of Local Taxon Ranges. Mathematical Geology 21(4): Marshall, C. R. (1990). Confidence-intervals on stratigraphic ranges. Paleobiology 16(1): Marshall, C. R. (1994). Confidence-intervals on stratigraphic ranges - partial relaxation of the assumption of randomly distributed fossil horizons. Paleobiology 20(4): Marshall, C. R. (1997). Confidence intervals on stratigraphic ranges with nonrandom distributions of fossil horizons. Paleobiology 23(2): Weiss, R. E. and C. R. Marshall (1999). The uncertainty in the true end point of a fossil s stratigraphic range when stratigraphic sections are sampled discretely. Mathematical Geology 31(4): Solow, A. R. (2003). Estimation of stratigraphic ranges when fossil finds are not randomly distributed. Paleobiology 29(2): Bradshaw, C. J. A., et al. (2012). Robust estimates of extinction time in the geological record. Quaternary Science Reviews 33:")
39
Assignment Download sampled occurrence data for a taxon of your interest from the PBDB (can be species or genus or family) (at least 7 data points) Write a short description of the taxon Using the data you downloaded, write an R script (annotated) to organize the data and to estimate the range end points using the methods presented in Marshall 1990 and Solow 2003. Write a summary of your observations What assumptions must you make and are these assumptions likely to have been violated? What are the consequences of the violations? Should you use the method given that assumptions have been violated or would you rather just report raw or mean values?

40
http://pbdb.org/ http://www.r-project.org/

41
Optional Assignments Marshall 1990 is based on continuous fossilization. Simulate both a continuous fossilization process and a discrete fossilization process and explore how much of an issue it is to violate the assumption that fossilization is continuous, in R. Solow 2003 seems like a dream, so simple and elegant. Simulate a few probable fossilization processes and apply Solow 2003 to them to check out how reliable the approach is, in R.

42
Summary *Question to be answer (Houle and Sepkoski) Sets Introduction to R Single taxon extinction *Paleobiology Database – As an example of data units *Simulation exercise
 Sets Introduction to R Single taxon extinction *Paleobiology Database – As an example of data units *Simulation exercise")
Similar presentations


. Assigning Probabilities A probability is a value between 0 and 1 and is written either as a fraction or as a proportion. For the.>")


Representativeness of the Sample: Does the sample accurately portray the population from which it is drawn 2)Time and Change: Was.>")


