Download presentation
Presentation is loading. Please wait.

1
Effectiveness of mailbased eSBI to university students An RCT study among 2858 third term college students att Linköping University, Sweden Professor Preben Bendtsen, Institution of Medicine and Health, Linköping University, Sweden

2
Background College and university students in most parts of the world may not drink very frequent but they have to drink excessively when they drink alcohol Earlier studies from sweden confirms this since 51% of female and 70 % of male students reported engaging in heavy episodic drinking defines as 5/4 or more standard drinks (12 gram of alcohol)
")
3
How to reach students? Social norms interventions – Social norms refers to our preception and beliefs what is ”normal” behaviour in the people close to us, and that these beliefs influence our behaviour – Misperceptions takes place when there is an underestimation or overestimation of the prevalence of behaviours/attitudes in a population/group Social norms intervention aims to correct such misunderstanding – hopefully leading to a change in the behaviour

4
Computerized personalized normative feedback Can provides students with information about actual student drinking norms Can offer a comparison between the students drinking pattern and the actual drinking norm Can offer a personal drinking profile with relevant advice Can be delived in various ways – Via email with an invitation to participate at a later stage in a special setting where the computerized test i performed – Via email with a hyperlink to a computerized test that is done on the students own computer – In a student health care setting

5
Current evidense for computerized normative interventions to college students Cochrane review by Moreira MT – juli 2009 – 22 RCT was included in the review involving 7275 college or university students – Computerized interventions was the most effective means of reaching students and showed an effect on: At 3 month: Alcohol related problems, Peak BAC, drinking frequency, drinking quantity and drinking norm At 6 month: Alcohol related problems, drinking frequency, drinking quantity, Binge drinking Effect sizes around 0,3-0,4

6
eSBi to university students in Sweden All third term university students at Linköping university was offered to perform a computerized alcohol habit test on their own computer via an email

7
Dear student For you who are a student at the third term at faculty of Medical Science Becoming a university student often entails a number of new challenges, work-related as well as socially. Most students may also experience during their studies the strongly rooted alcohol culture prevailing in the student world. This mail contains a link to a test which enables you to get an overview of your alcohol habits. The test takes about 5-10 minutes to carry out and you will get a survey of your habits immediately after finishing the test. To access the test click the link below, which contains a coded link to the computer test. This means that no one else can trace your answers. Doing the test is of course completely voluntary. Your answers will be treated confidentially and you can break off the test whenever you want. The test cannot be traced to your person. Click here to take survey ! Click here to take survey ! The test is part of a development project in cooperation between Student Health Care at a number of universities in Sweden and the National Institute of Public Health. Professor Preben Bendtsen, coordinator for Lifestyle Intervention Research Group at Linköping University, has developed the test based on previous research in the field. If you have any questions about the test you can mail goran.larsson@vxu.se at the Växjö University Student Health Centre or call Göran Larsson at 0470-70 82 66 or mail info@alexit.se to reach those who have programmed the actual test. If you want further information on alcohol-related issues you are welcome to contact the Student Health Centre at Växjö University. We hope you will take the chance to test your alcohol habits! Best regards, the Student Health Care Centre, Växjö University.goran.larsson@vxu.seinfo@alexit.se The content of the email

8
Välkommen! Här får du möjlighet att testa och se om, och i så fall hur, dina alkoholvanor har förändrats sedan sist. Testet tar ca 5 minuter. När du besvarat alla frågor presenteras en sammanställning av dina alkoholvanor. Du avgör själv om/hur du vill gå vidare med resultatet. Välkommen! Gå vidare

9
Är du kvinna eller man? Man 21-25 41-45 26-30 46-50 Bakgrundsdata Tillbaka Gå vidare Vid vilken fakultet studerar du? TekFak Ange din ålder 31-35 51- 18-20 36-40 FilFak HU Kvinna Utbildnings- vetenskap

10
Hur mycket dricker du under en typisk vecka? Måndag Tisdag Onsdag Torsdag Fredag Lördag Söndag Hur många standardglas? Veckokonsumtion Tillbaka Gå vidare Standardglas, exempel 1 standardglas 1 burk folköl (50 cl) 1 glas vin (15 cl) 4 cl sprit 1 flaska starköl/starkcider/alkoläsk (33 cl) 1.5 standardglas 1 burk starköl/stor stark 5% (50 cl) 2 standardglas 1 burk starköl 7-8 % (50 cl) 3 standardglas 1 burk starköl 10% (50 cl) 7.5 standardglas 1 flaska vin (75 cl)
 1 glas vin (15 cl) 4 cl sprit 1 flaska starköl/starkcider/alkoläsk (33 cl) 1.5 standardglas 1 burk starköl/stor stark 5% (50 cl) 2 standardglas 1 burk starköl 7-8 % (50 cl) 3 standardglas 1 burk starköl 10% (50 cl) 7.5 standardglas 1 flaska vin (75 cl).")
11
Har dina alkoholvanor fått negativa konsekvenser? Nej, inga Konsekvenser Tillbaka Gå vidare Ja, för: Studierna Ekonomin Relationen till familj och vänner Att jag hamnat i situationer jag ångrat Sömnen Min psykiska hälsa Att jag har skadat mig fysiskt Att jag hamnat i bråk/blivit utsatt för våld

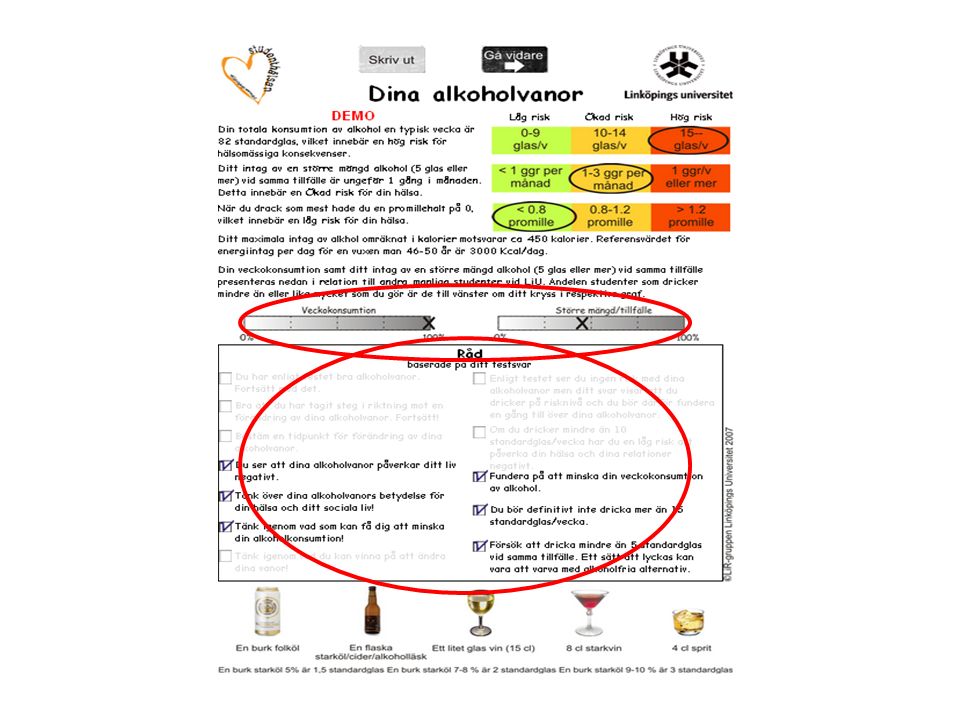
12
Short feedback

14
2 858 students were invited to participate by mail Agreed to participate n=145 Agreed to participate n=148 Response at 3 months n=125 Response at 3 months n=114 6 month follow-up Response from baseline and 3 months N=80 6 month follow-up Response from baseline and 3 months N=78 Intervention group n=330 Control group n=323 1 120 students completed the test Students who were categorized as non-risky drinkers at baseline n=464 3 students had very high weekly consumption Response rate

15
Long feedback, n (%) Short feedback, n (%) Gender (p=0,907) Male73(49)70(48) Female75(51)75(52) Total148(100)145(100) Age (p=0.806) 18-2021(14)25(17) 21-25117(79)111(77) ≥ 26 10(7)9(6) Total148(100)145(100) University section (p=0.991) Faculty of arts and science 69(47)70(48) Institute of technology 54(37)51(35) Institute of education 10(7) Faculty of arts health sciences 15(10)14(10) Total148(100)145(100) Weekly consumption, g/week (p=0.296) Median (range)84(468)84(396) Mean (SE)110.5(6.5)101.5(5.6) Highest promille (p=0.589) Median (range)1.26(4.55)1.20(4.97) Mean (SE)1.34(0.07)1.29(0.07) HED (p=0,869) Median (range)3(29)3(27) Mean (SE)5.8(0.3)
 Short feedback, n (%) Gender (p=0,907) Male73(49)70(48) Female75(51)75(52) Total148(100)145(100) Age (p=0.806) (14)25(17) (79)111(77) ≥ 26 10(7)9(6) Total148(100)145(100) University section (p=0.991) Faculty of arts and science 69(47)70(48) Institute of technology 54(37)51(35) Institute of education 10(7) Faculty of arts health sciences 15(10)14(10) Total148(100)145(100) Weekly consumption, g/week (p=0.296) Median (range)84(468)84(396) Mean (SE)110.5(6.5)101.5(5.6) Highest promille (p=0.589) Median (range)1.26(4.55)1.20(4.97) Mean (SE)1.34(0.07)1.29(0.07) HED (p=0,869) Median (range)3(29)3(27) Mean (SE)5.8(0.3)")
16
Non- participants, n (%) p-value (non- participants vs non- responders) Non- responders, n (%) p-value (non- responders vs responders) Responders, n (%) p-value (non- participants vs responders) Gender (p=0.013) Male195(54)77(57)66(42) Female165(46)58(43)92(58) Total360(100)0.612135(100)0.010158(100)0.010 Age, years (p=0.028) 18-2091(25)21(16)25(16) 21-25246(68)108(80)120(76) ≥ 26 23(6)6(4)13(8) Total360(100)0.037135(100)0.428158(100)0.048 University section (p=0.608) Faculty of arts and science 151(42)59(44)80(51) Institute of technology 133(37)53(39)52(33) Institute of education 32(9)10(7)10(6) Faculty of arts health sciences 44(12)13(10)16(10) Total360(100)0.820135(100)0.635158(100)0.320 Type of feedback (p=0.999) Long182(51)68(50)80(51) Short178(49)67(50)78(49) Total360(100)1.000135(100)1.000158(100)1.000
 p-value (non- participants vs non- responders) Non- responders, n (%) p-value (non- responders vs responders) Responders, n (%) p-value (non- participants vs responders) Gender (p=0.013) Male195(54)77(57)66(42) Female165(46)58(43)92(58) Total360(100) (100) (100)0.010 Age, years (p=0.028) (25)21(16)25(16) (68)108(80)120(76) ≥ 26 23(6)6(4)13(8) Total360(100) (100) (100)0.048 University section (p=0.608) Faculty of arts and science 151(42)59(44)80(51) Institute of technology 133(37)53(39)52(33) Institute of education 32(9)10(7)10(6) Faculty of arts health sciences 44(12)13(10)16(10) Total360(100) (100) (100)0.320 Type of feedback (p=0.999) Long182(51)68(50)80(51) Short178(49)67(50)78(49) Total360(100) (100) (100)1.000")
17
Non- participants, n (%) p-value (non- participants vs non- responders) Non- responders, n (%) p-value (non- responders vs responders) Responders, n (%) p-value (non- participants vs responders) Weekly consumption, g/week (p=0.029) Median (range)84(492)90(468)84(300) Mean (SE)111.3(4.3)0.385118.6(7.5)0.00995.4(4.6)0.012 Highest promille (p=0.567) Median (range)1.3(5.5)1.2(4.9)1.2(4.6) Mean (SE)1.34(0.04)0.7591.37(0.08)0.3341.27(0.06)0.364 Frequency of HED, no. of HED occasions/month (p=0.408) Median (range)3(27)8(13)3(29) Mean (SE)5.8(0.2)0.7235.9(0.3)0.2235.7(0.3)0.254
 Median (range)3(27)8(13)3(29) Mean (SE)5.8(0.2) (0.3) (0.3)")
18
Effectiveness of the two types of feedback Baseline and 3 month Long feedback (n=125) Short feedback (n=114) p- value Average weekly consumption (g) at baseline, mean (median) 109.2(84)96.4(84)0.175 Average weekly consumption (g) at follow-up, mean (median) 110.3(96)114.0(96)0.701 Absolute change in average weekly consumption, g (p-value) 1.1(0.800) a 17.6(0.002) b 0.057 Relative change in average weekly consumption, % 118 Average highest promille at baseline, mean (median) 1.35(1.2)1.22(1.1)0.228 Average highest promille at follow-up, mean (median) 1.20(1.1)1.13(0.9)0.513 Absolute change in average highest promille, g (p-value) -0.15(0.027) c -0.09(0.179) d 0.484 Relative change in average highest promille, % -11-7 Number of HED occasions per month at baseline, mean (median) 5.8(3)5.6(3)0.559 Number of HED occasions per month at follow-up, mean (median) 3.5(3)3.6(3)0.421 Absolute change in no. of HED occasions per month (p-value) -2.3(0.000) e -2.0(0.000) f 0.315 Relative change in no. of HED occasions per month, % -40-36 Changed from risk to no risk, % 35300.489
 -2.3(0.000) e -2.0(0.000) f Relative change in no. of HED occasions per month, % Changed from risk to no risk, %")
19
Long feedback (n=80) Short feedback (n=78) p- value Average weekly consumption (g) at baseline, mean (median) 96.5(84)94.3(84)0.813 Average weekly consumption (g) at follow-up, mean (median) 100.8(72)108.6(102)0.481 Absolute change in average weekly consumption, g (p-value) 4.3(0.552) a 14.3(0.003) b 0.162 Relative change in average weekly consumption, % 415 Average highest promille at baseline, mean (median) 1.26(1.2)1.29(1.2)0.867 Average highest promille at follow-up, mean (median) 1.11(1.0)1.10(1.0)0.915 Absolute change in average highest promille, g (p-value) -0.15(0.067) c -0.19(0.012) d 0.765 Relative change in average highest promille, % -12-15 Number of HED occasions per month at baseline, mean (median) 5.6(3)5.7(3)0.859 Number of HED occasions per month at follow-up, mean (median) 3.7(3)4.2(3)0.603 Absolute change in no. of HED occasions per month (p-value) -1.9(0.000) e -1.5(0.003) f 0.426 Relative change in no. of HED occasions per month, % -34-26 Changed from risk to no risk, % 2530 Effectiveness of the two types of feedback Baseline and 6 month
 -1.9(0.000) e -1.5(0.003) f Relative change in no. of HED occasions per month, % Changed from risk to no risk, % 2530 Effectiveness of the two types of feedback Baseline and 6 month.")
20
Conclusion Email based computerized screening appears to have an effect on heavy episodic drinking and higesth BAC but not on the total weekly consumption in the present study on third term students No difference was found between a short feedback, only summarizing the students drinking in relation to sensible drinking limits, and a more comprehensive normative feedback. Why no difference was found is unclear Future studies should include a true control group not beeing assessed at baseline – and strive to have a higher attrition rate

Similar presentations


>")


