Download presentation
Presentation is loading. Please wait.

1
Lawrence Hunter, Ph.D. Director, Computational Bioscience Program University of Colorado School of Medicine Larry.Hunter@uchsc.edu http://compbio.uchsc.edu/Hunter Microarrays Tzu Lip Phang, Ph.D. Associate Professor of Bioinformatics Division of Pulmonary Sciences and Critical Care Medicine University of Colorado School of Medicine Tzu.Phang@ucdenver.edu

2
The Central Dogma Transcriptome Genome

3
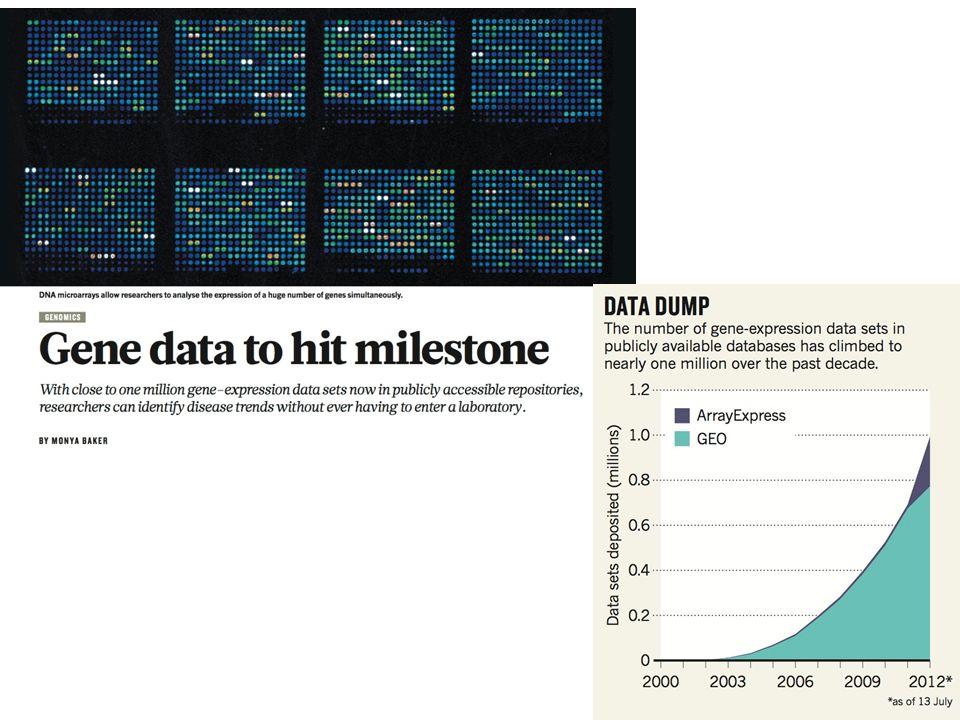
Microarrys in the Literature

5
Barrett, T., Wilhite, S. E., Ledoux, P., Evangelista, C., Kim, I. F., Tomashevsky, M., et al. (2012). NCBI GEO: archive for functional genomics data sets--update. Nucleic acids research, 41(D1)
. NCBI GEO: archive for functional genomics data sets--update. Nucleic acids research, 41(D1).")
6
Public Data Usages Preliminary Data/Results, hypothesis generation Test Algorithm Power Analysis (sample size calculation) Enhance sample size
 Enhance sample size")
7
Array technology Basic idea: Genomic material DNA/RNA hybridizes best to exactly complementary sequences. Method: – Probes are attached to a substrate in a known location – DNA/RNA in one or more samples are fluorescently labelled – samples are hybridized to probe array, excess is washed off, and fluorescence reading are taken for each position

8
Microarray: Primer

9
Array synthesis Photolithography for oligonucleotides Cost proportional to length of oligo, not number of features (genes) per chip! Many layers compared to computer chips.

10
Affymetrix Probe Sets (11 to 16) 25mer AAAA.. 25mer PM MM http://intermedin.stanford-edu/Arrays.ppt
 25mer AAAA.. 25mer PM MM")
11
Gene Expression Still most common use for microarrays Aim to determine differential expression between groups of samples e.g. disease and control Generate hypotheses about the mechanisms underlying the disease of interest

12
Basic Statistical Analysis

13
Experimental Design Biological replication is essential – Technical replication not essential except for quality control studies Pooling biological samples to reduce array variability – Increase sample size without running more chips – BUT, if individual variation is important, pooling wash out the effect Power Analysis is essential

14
Power Analysis How many biological replication? My experience; at least 3, preferably 5, even 7 Bioconductor: SSPA

15
Preprocessing Including image analysis, normalization, and data transformation Data normalization: – Remove systematic errors introduced in labeling, hybridization and scanning procedures – Correct these errors while preserve biological variability / information

16
Why normalization?

17
A different look … Technical replicate difference Average Intensity Values

18
To normalize or not to …

19
AffyComp Rafael Irizarry, Dept BioStat John Hopkins University

20
Statistical Testing Hypothesis Testing: Is the means of two groups different from each other – Fold Change – Student-T Test

21
Microarray Scatter Plot

22
Student-T Test

23
What is Multiple Comparison Testing??! GenesP-values Critical levelHo Gene 10.0001<=0.051 Gene 20.0002<=0.051 Gene 30.008<=0.051 Gene 40.009<=0.051 Gene 50.005<=0.051 Gene 60.09<=0.050 Gene 70.05<=0.050 Gene 80.09<=0.050 Gene 90.2<=0.050 Gene 100.3<=0.050 Alpha level = 0.05

24
When large number of tests … GenesP-values Critical levelHo Gene 10.0001<=0.051 Gene 20.0002<=0.051 Gene 30.008<=0.051 Gene 40.009<=0.051 Gene 50.005<=0.051 Gene 60.09<=0.050 …………… …………… Gene 9990.2<=0.050 Gene 10000.3<=0.050 Alpha level = 0.05 50 wrong genes …

25
Correction … Bonferroni GenesP-values Critical levelHo Gene 10.0001<=0.000050 Gene 20.0002<=0.000050 Gene 30.008<=0.000050 Gene 40.009<=0.000050 Gene 50.005<=0.000050 Gene 60.09<=0.000050 ……… … ……… … Gene 9990.2<=0.000050 Gene 10000.3<=0.000050 Alpha level = 0.05 / 1000 = 0.00005

26
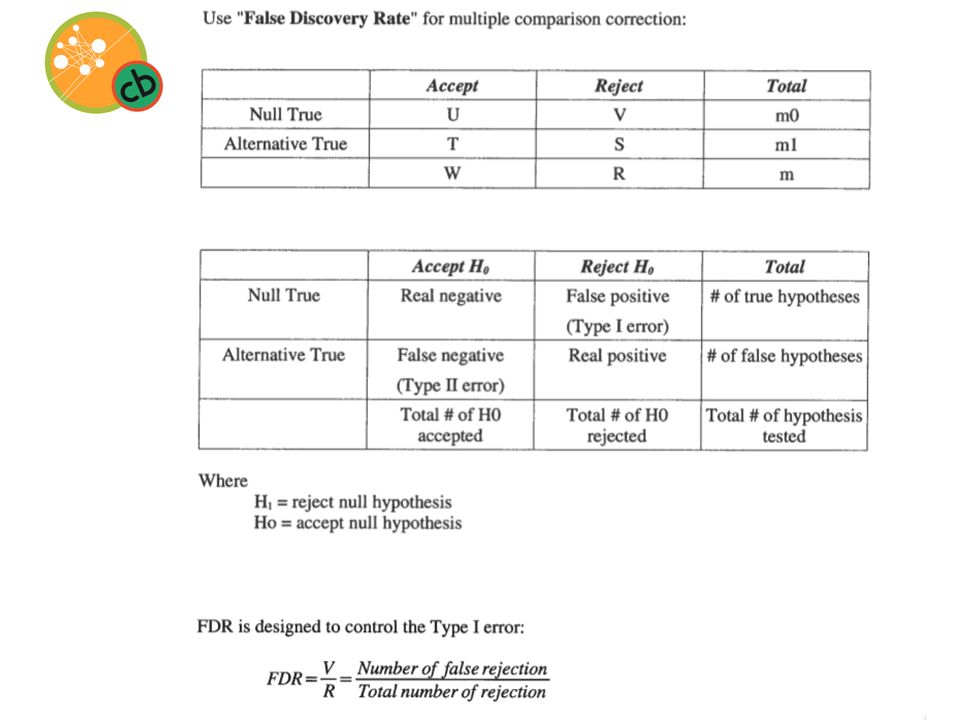
Strike the balance … BonferroniNo correction False Discovery Rate Most ConservativeMost Lenient The False Discovery Rate (FDR) of a set of predictions is the expected percent of false predictions in the set of predictions. Example: If the algorithm returns 100 genes with false discovery rate of 0.3, then we should expect 70 of them to be correct

29
Put them together

30
Result Validation RT-PCR: most common method Gene levels at the borderline of differential expression – Their measurability reduce by random error For highly differentially expressed genes, having sufficient replicates would serve as validation.

31
Biological Interpretation

Similar presentations


 = 113.5 bp median(nucs) = 110 bp sd(nucs+ = 17.3.>")


 Isolate total RNA Isolate mRNA from total RNA (poly.>")


 DNA Microarray, 2d gel, MSMS, yeast 2-hybrid.>")
