Download presentation
Presentation is loading. Please wait.

1
Kelly Ransdell Southern Regional Public Education Advisor

2
National estimates derived from ◦ NFPA annual fire department survey Big numbers ◦ USFA’s National Fire Incident Reporting System (NFIRS) Details Also reports from fire departments about specific incidents
 Details Also reports from fire departments about specific incidents")
4
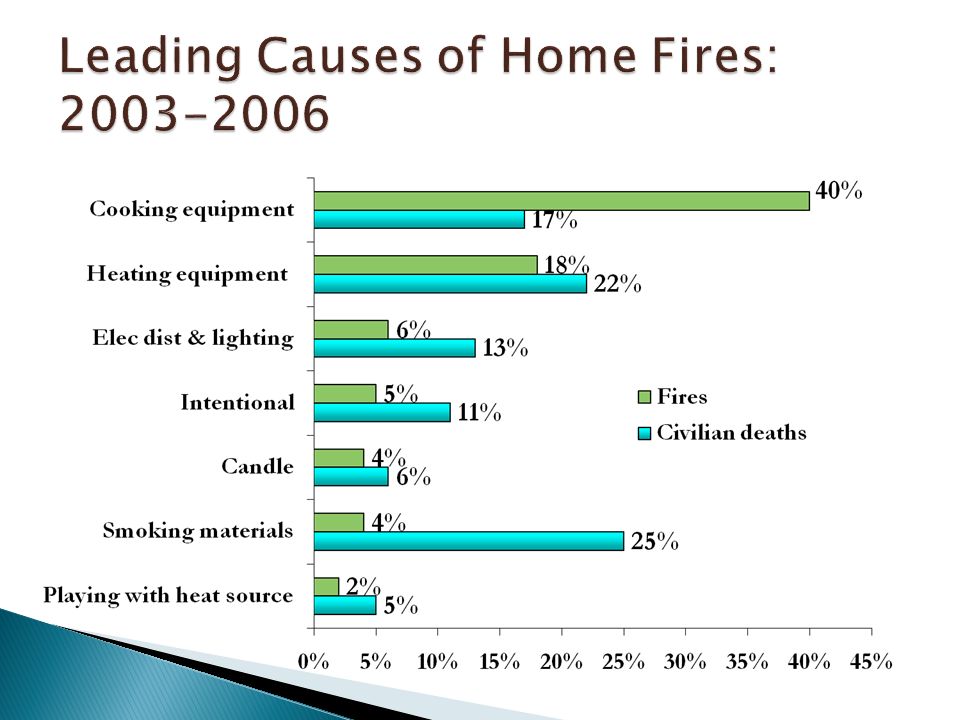
Leading cause of fires and fire injuries ◦ Third leading cause of home fire deaths Unattended cooking is main contributing factor ◦ Clothing ignitions while cooking are more likely to result in injury or death than other cooking fires Frying poses more risk of fire than other types of cooking More than half of cooking fire injuries occurred when people tried to fight the fire themselves

5
Young children are at low risk of cooking fire injuries, but high risk of contact burns and scalds from ◦ Cooking equipment, cookware and tableware ◦ Hot foods or beverages

6
57% of reported cooking fire injuries occurred during civilian attempts at fire control CPSC: Households handle an average of 4.7 million cooking fires per year without the fire department ◦ 1 reported cooking fire for every 50 unreported

7
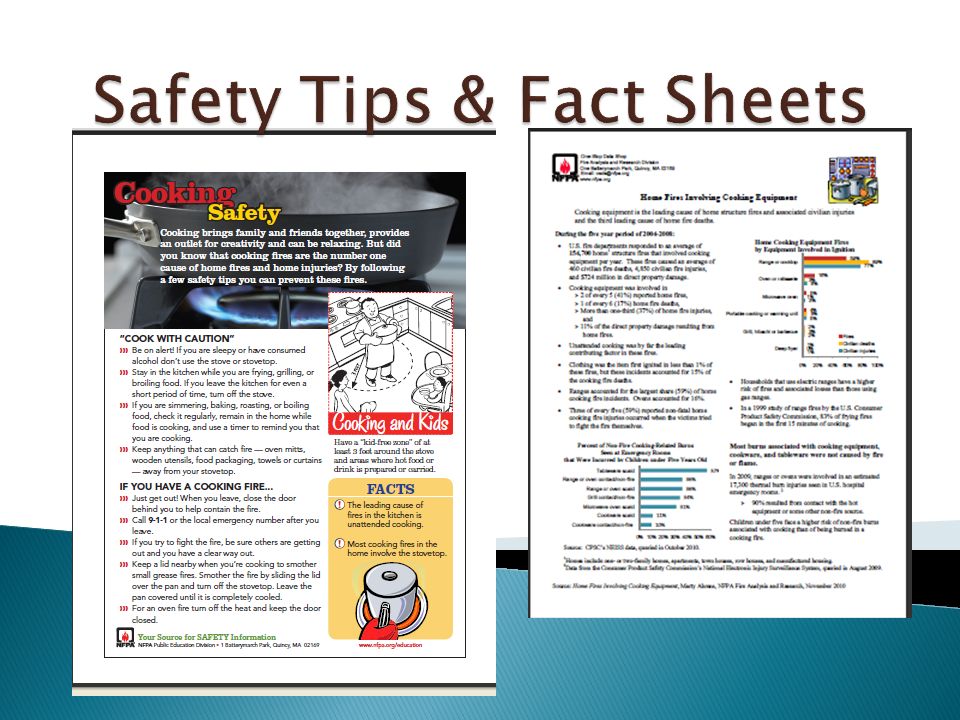
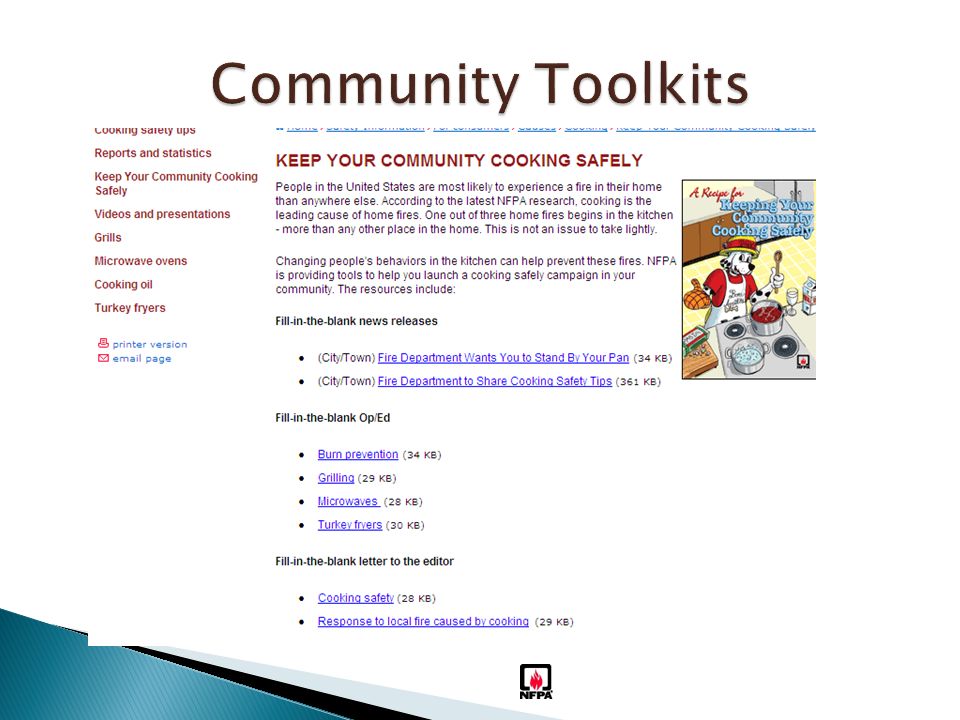
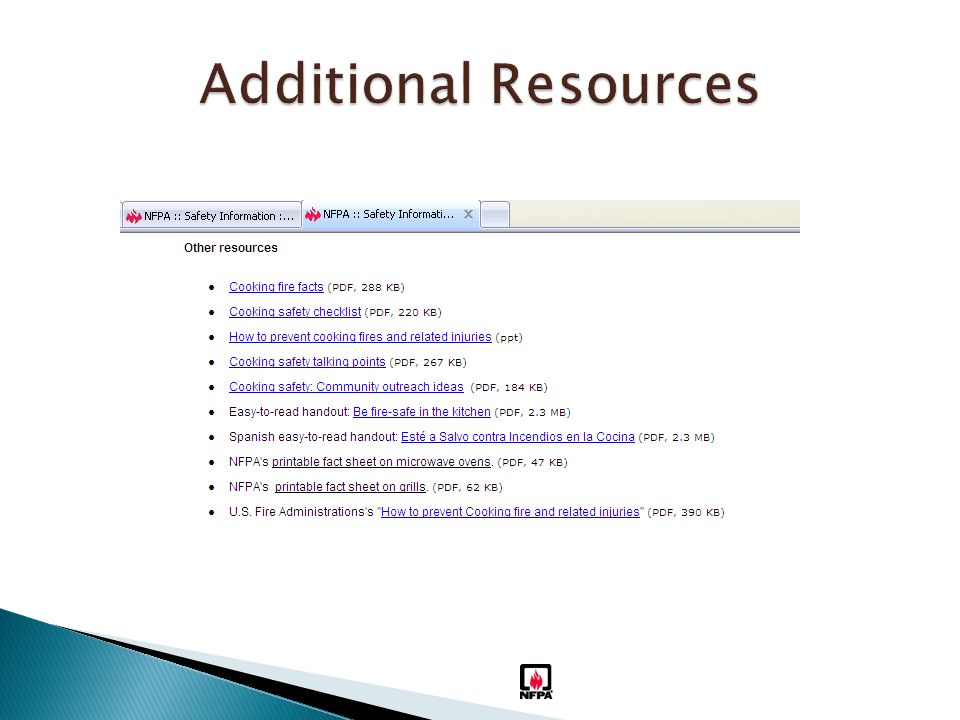
USFA funded NFPA project on cooking ◦ Report, PowerPoint and videos are with NFPA’s cooking fact sheet Cooking resources Cooking resources

11
Dan Doofus: Kitchen for Trouble FEMA VideosVideos Keep Kids Away Know what to do in a fire Prevent Scalds & Burns

12
Now done for almost all reports Designed to provide concise and vetted statistical language Can be copied Available free to all website visitors Use to support safety tips

Similar presentations


>")


 for children ages 1 to 19 years.>")


