Download presentation
Presentation is loading. Please wait.

1
6

2
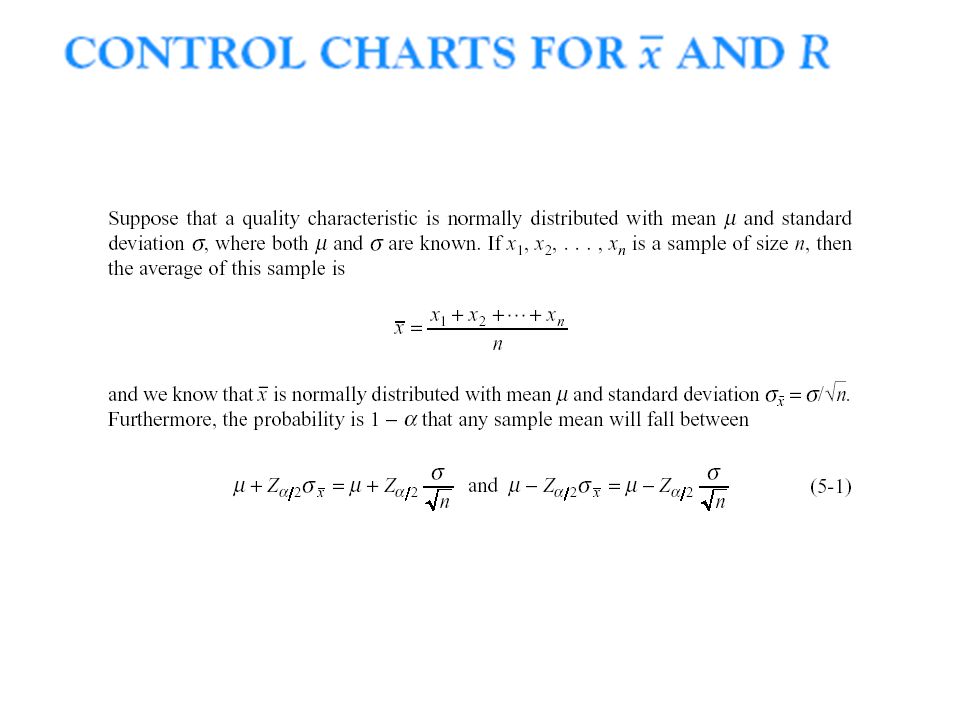
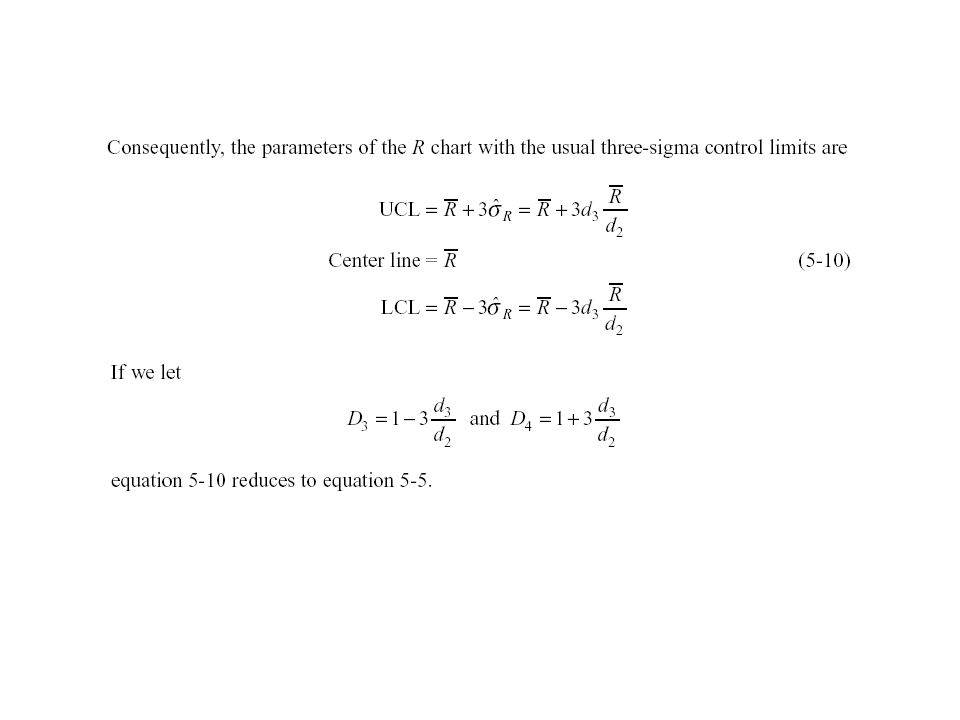
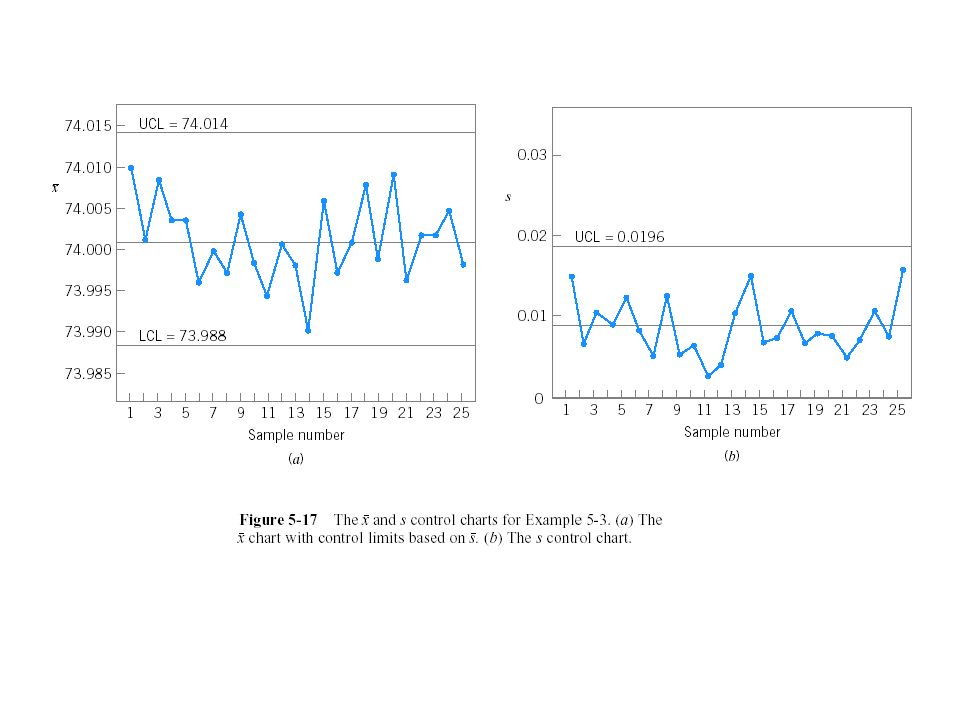
Control chart for variable It is important to control over both the process mean and the process variability. –Control the process by using the x chart –Control the process variability by R chart Control chart has two plotting areas –An upper graph in which the individual or the average value of the sample or subgroup is plotted. –The lower graph plots the R chart or s chart or moving range chart.

4
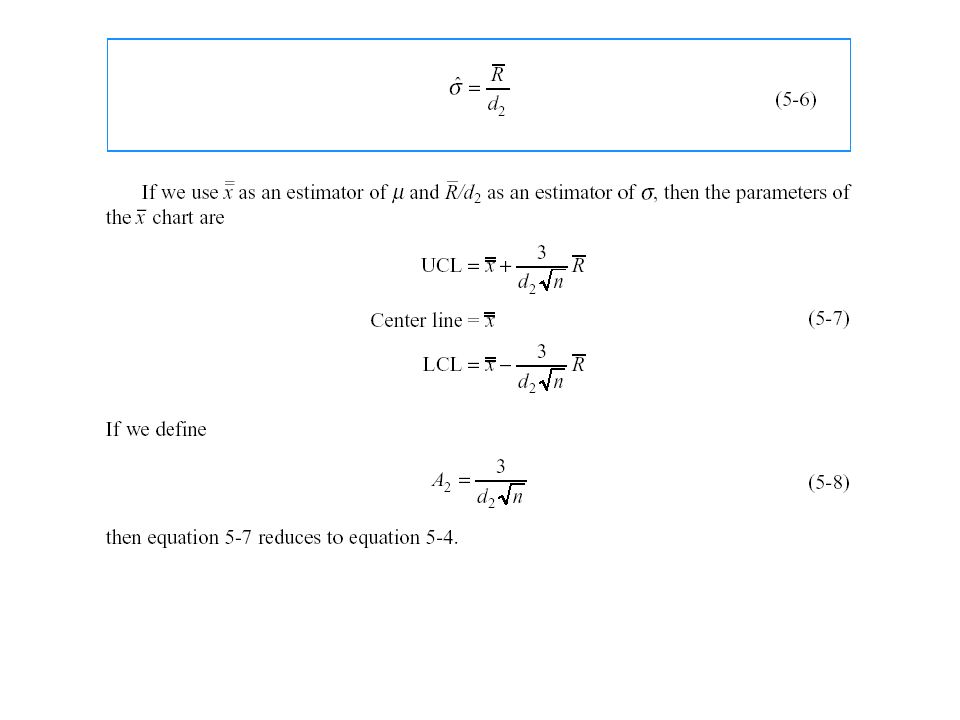
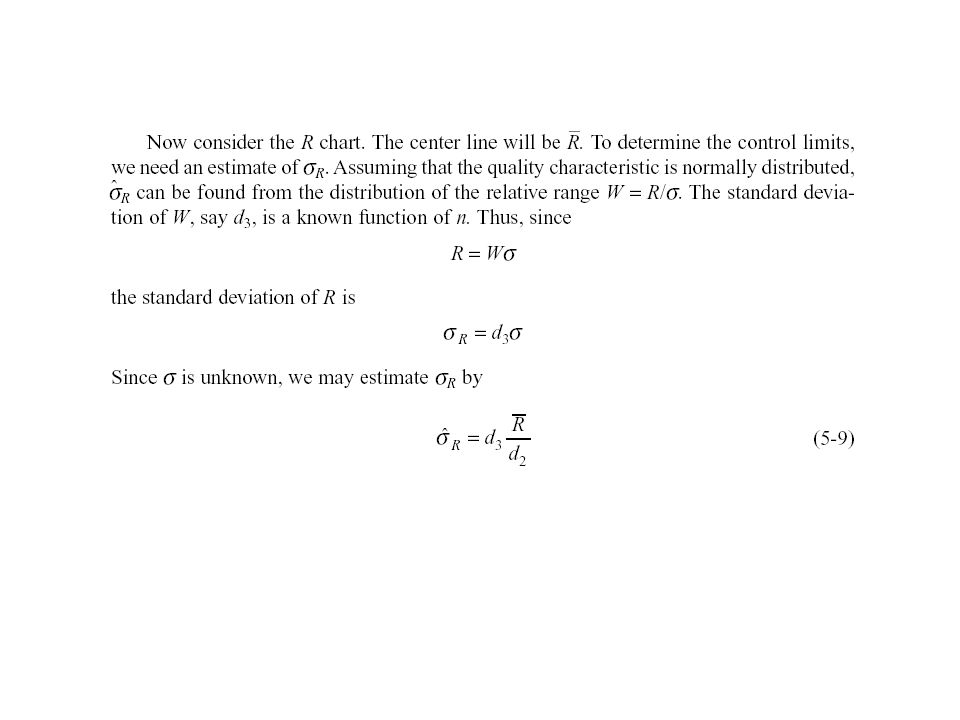
Subgroup Data with Unknown and

9
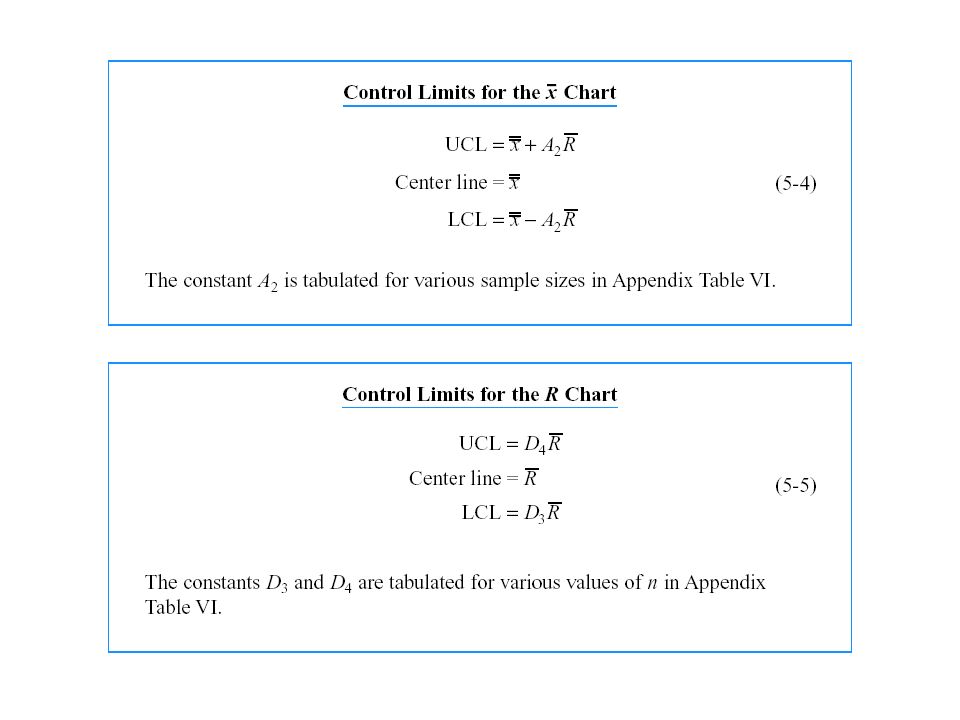
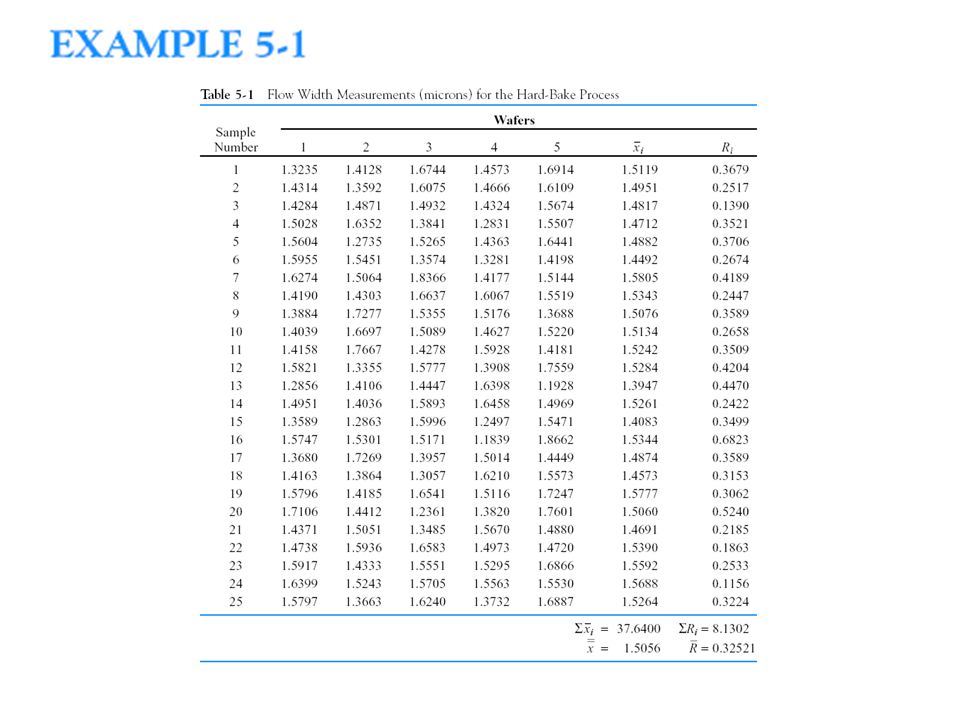
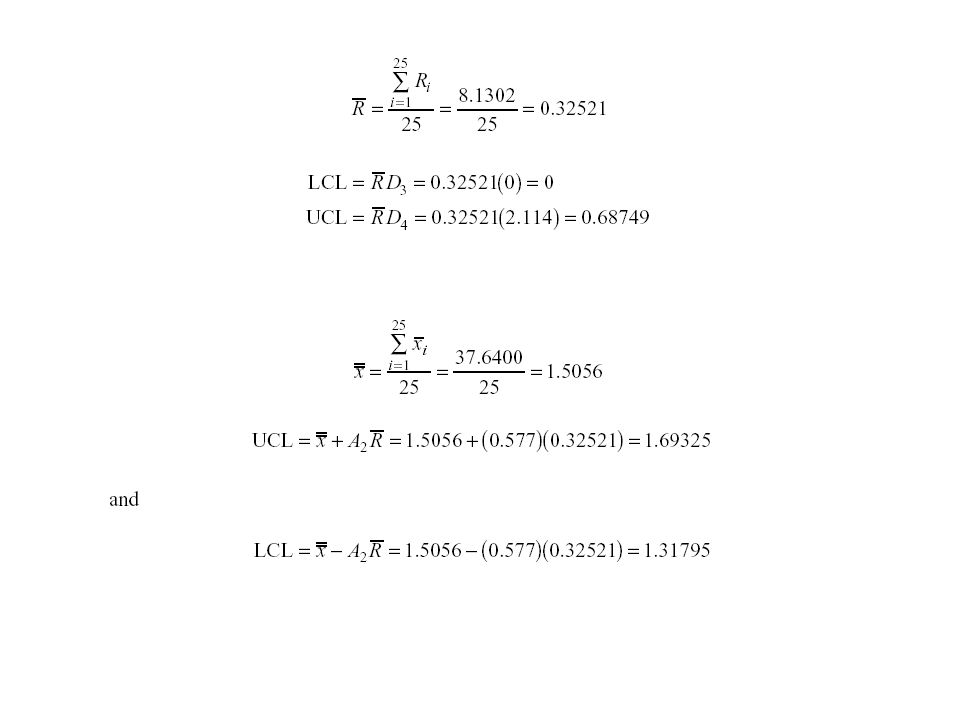
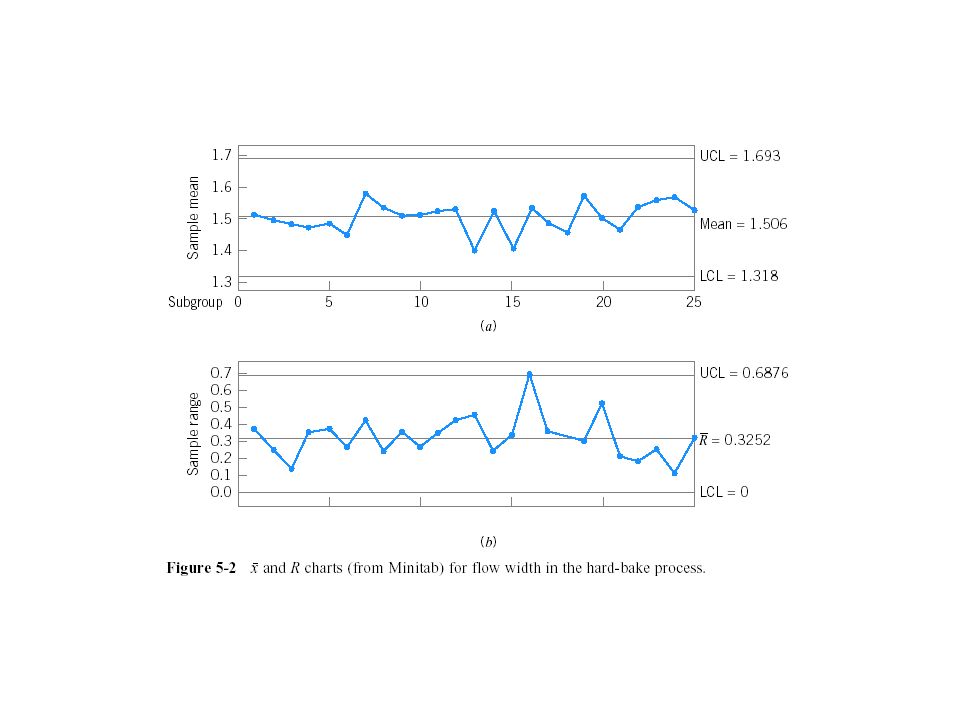
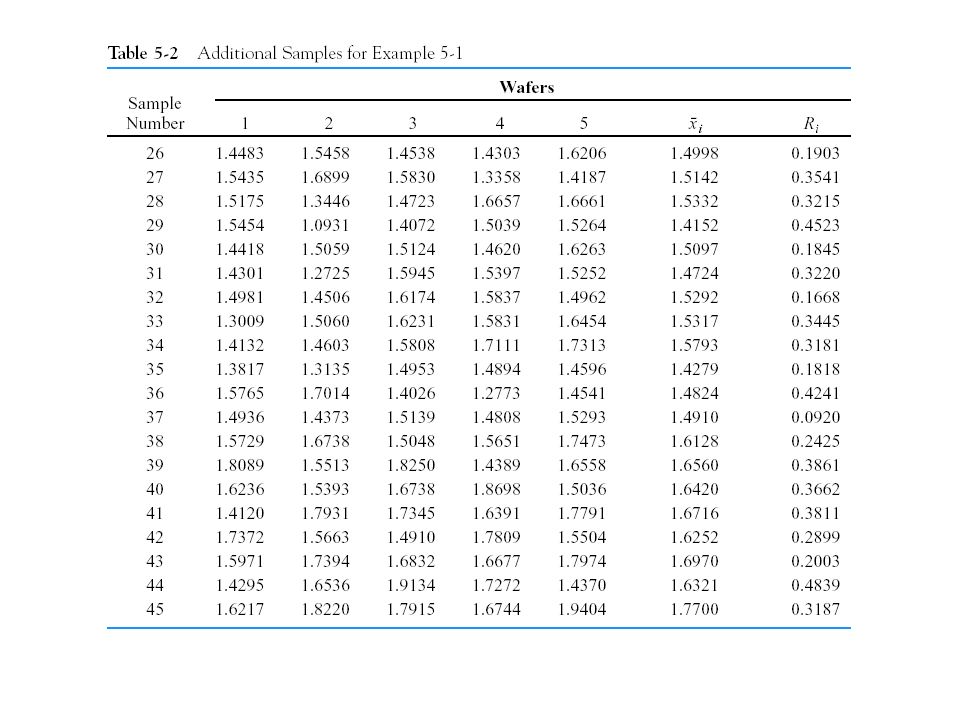
Phase I Application of and R Charts Eqns 5-4 and 5-5 are trial control limits To determine if the process is in control when the initial samples were taken, plot the values of mean and R from each sample on the chart and analyze. If all the points are within the limit and there is no systematic pattern, then the trial control limits can be used in the future. –Determined from m initial samples Typically 20-25 subgroups of size n between 3 and 5 –Any out-of-control points should be examined for assignable causes If assignable causes are found, discard points from calculations and revise the trial control limits using the remaining points. Continue examination until all points plot in control Adopt resulting trial control limits for use If no assignable cause is found, there are two options 1.Eliminate point as if an assignable cause were found and revise limits 2.Retain point and consider limits appropriate for control –If there are many out-of-control points they should be examined for patterns that may identify underlying process problems

13
Revision of Control Limits and Center Lines Effective use of control charts requires periodic review and revision of control limits and center lines Sometimes users replace the center line on the chart with a target value When R chart is out of control, out-of-control points are often eliminated to recompute a revised value of which is used to determine new limits and center line on R chart and new limits on chart

14
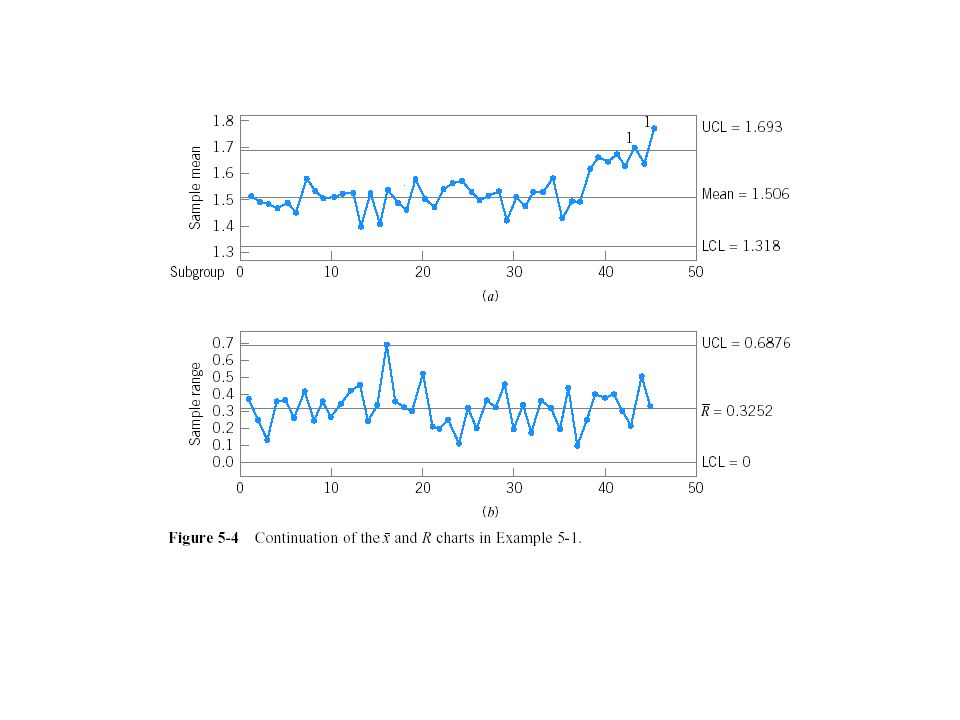
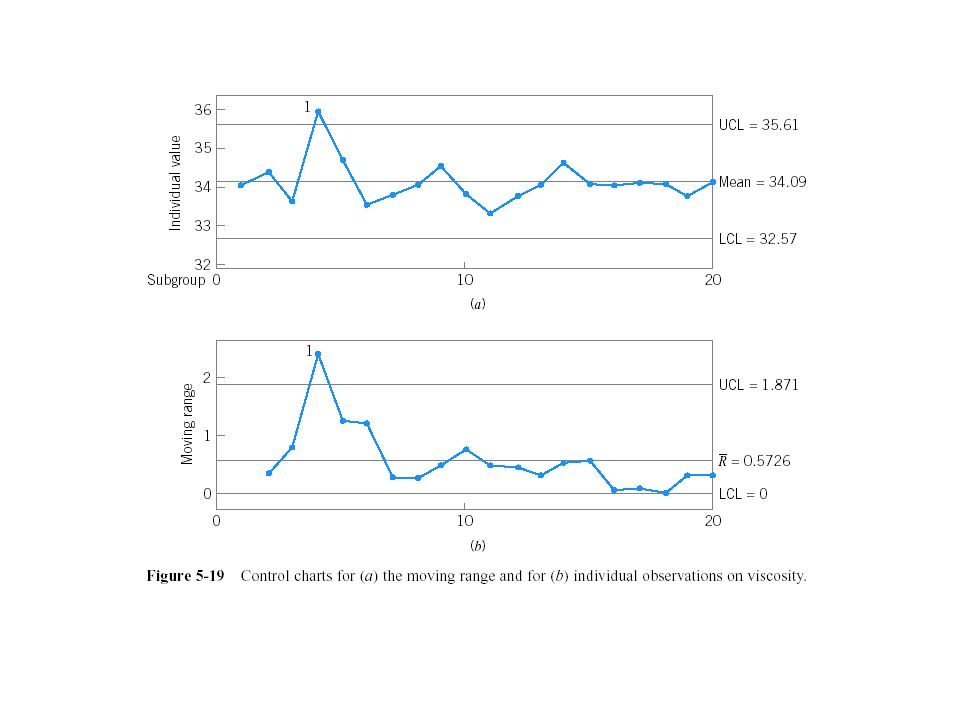
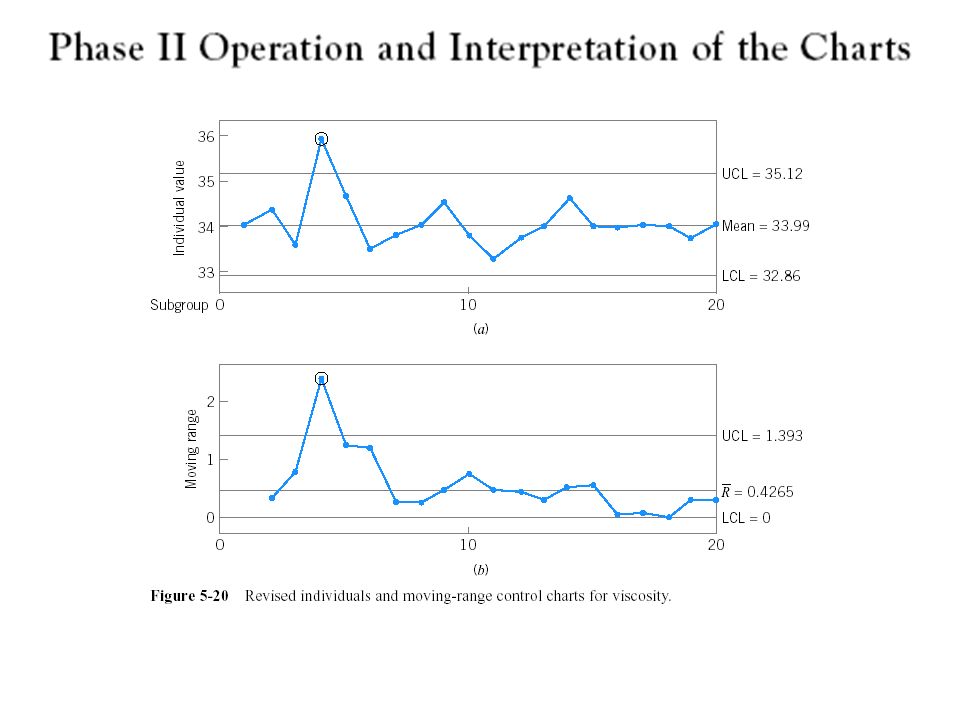
Phase II Operation of Charts Use of control chart for monitoring future production, once a set of reliable limits are established, is called phase II of control chart usage (Figure 5-4) A run chart showing individuals observations in each sample, called a tolerance chart or tier diagram (Figure 5- 5), may reveal patterns or unusual observations in the data
 A run chart showing individuals observations in each sample, called a tolerance chart or tier diagram (Figure 5- 5), may reveal patterns or unusual observations in the data")
23
Rules for interpreting XmR charts For X portion : apply WECO four rules For mR portion apply rule 1 only.

Similar presentations


 Peter Ping Liu, Ph D, PE, CQE, OCP and CSIT Professor and Coordinator of Graduate Programs.>")


 2009 John Wiley & Sons, Inc.>")


>")


