Download presentation
Presentation is loading. Please wait.

1
Research & Experimental Design Why do we do research History of wildlife research Descriptive v. experimental research Scientific Method Research considerations Sampling

2
Wildlife Ecology Research Why do we do it? Understand and explain –Patterns and processes What, why, and how Predictions Monitoring Management and conservation

3
Rigor in Wildlife Ecology Historically –Descriptive Monitoring Natural history observations “Conclusions” from associations rather than experimental tests of hypotheses

4
Rigor in Wildlife Ecology Ecologists vs. Physicists & Chemists –Control & controls –Replication –Manipulation –Cause & effect Ecologists have a greater challenge Statistics and other quantitative methods –Graphical, observational, information theory, etc…

5
Experimental vs. Descriptive Research Historically descriptive –monitoring Experimental research more powerful What’s the difference?

6
Descriptive Research Broad objectives rather than tests of specific hypotheses Can provide valuable information –Management & conservation Limitations –Best if used in research hypothesis (conceptual model) formulation, monitoring, and description
 formulation, monitoring, and description")
7
Experimental Research Tests are made to examine the validity of a hypothesis Greater understanding and advancement of knowledge –Can be difficult or impossible e.g., weather effects on pheasant abundance

8
Scientific Method Best method of advancing knowledge Ideal method Used much? Hypothetico-deductive Method –Multiple working hypotheses –Falsification

9
Scientific Method Identify the Research Problem (#1) Guides literature review and data collection Applied vs. Basic research –e.g., the number of pheasant broods seems to change from year to year

10
Scientific Method Literature Review (#2) Find possible explanations –e.g., the amount of spring rainfall has been found to effect broods of numerous species Avoid duplication Develop methodologies
 Find possible explanations –e.g., the amount of spring rainfall has been found to effect broods of numerous species Avoid duplication Develop methodologies")
11
Scientific Method Identify Broad Research Objectives (#3) General course of action Preliminary plan –e.g., to identify and understand reasons for inter-annual differences in the number of pheasant broods Study pheasant broods and some environmental factors such as rainfall
 General course of action Preliminary plan –e.g., to identify and understand reasons for inter-annual differences in the number of pheasant broods Study pheasant broods and some environmental factors such as rainfall")
12
Scientific Method Collect Preliminary Data (#4) Pilot study –“Mini-study” –e.g., count pheasant broods over several years Literature Review
 Pilot study – Mini-study –e.g., count pheasant broods over several years Literature Review")
13
Scientific Method Exploratory Data Analysis (#5) Review and synthesis of data from pilot study or literature review –Describe broad patterns
 Review and synthesis of data from pilot study or literature review –Describe broad patterns")
14
Scientific Method Steps 1-5 = Descriptive Research Identify the Research Problem Literature Review Identify Broad Research Objectives Collect Preliminary Data Exploratory Data Analysis

15
Scientific Method Formulate a Research Hypothesis (Conceptual Model) (#6) From observed associations (pilot study or literature) –e.g., we observed more pheasant broods during years with below-average spring rainfall –Reliability? Research hypothesis = Most likely explanation –H 1 : above-average spring rain reduces survival of pheasant broods

16
Scientific Method Formulate a Research Hypothesis (Conceptual Model) (#6) Alternative Hypotheses –A 1 : destruction of pheasant nests by tractors is greatest during years of above-average rain –A 2 : above-average spring rainfall results in greater plant growth, which reduces observability of pheasant broods
 (#6) Alternative Hypotheses –A 1 : destruction of pheasant nests by tractors is greatest during years of above-average rain –A 2 : above-average spring rainfall results in greater plant growth, which reduces observability of pheasant broods")
17
Scientific Method Formulate Predictions as Testable (often Statistical) Hypotheses (#7) Research Hypotheses represent theories
 Hypotheses (#7) Research Hypotheses represent theories")
18
Scientific Method Formulate Predictions as Testable (often Statistical) Hypotheses (#7) Testable Hypotheses represent predictions from theories –H 1 : during years of above-average spring rainfall, broods will have lower daily survival –A 2a : during years of above-average spring rainfall, vegetation will grow more dense –A 2b : in brood habitat, sites with greater vegetation density will reduce the observability of pheasant broods
 Hypotheses (#7) Testable Hypotheses represent predictions from theories –H 1 : during years of above-average spring rainfall, broods will have lower daily survival –A 2a : during years of above-average spring rainfall, vegetation will grow more dense –A 2b : in brood habitat, sites with greater vegetation density will reduce the observability of pheasant broods")
19
Scientific Method Formulate Predictions as Testable (often Statistical) Hypotheses (#7) Testable form Truth and proof –Reject or fail to reject
 Hypotheses (#7) Testable form Truth and proof –Reject or fail to reject")
20
Scientific Method Design Research and Methodology for each Hypothesis to be Tested (#8) Pilot study –Logistics –Methodology problems –Quality of data & samples size
 Pilot study –Logistics –Methodology problems –Quality of data & samples size")
21
Scientific Method Design Research and Methodology for each Hypothesis to be Tested (#8) Research Design Options –Uncertainty vs. applicability (inferential ability & space) Manipulative vs. observational research Lab vs. field research
 Manipulative vs. observational research Lab vs. field research.")
22
Scientific Method Design Research and Methodology for each Hypothesis to be Tested (#8) Ideal Research Design? –Manipulative field research –Integrated research approach

23
Scientific Method Design Research and Methodology for each Hypothesis to be Tested (#8) For each hypothesis –What data to collect, when, how, how much, and for how long?
 For each hypothesis –What data to collect, when, how, how much, and for how long")
24
Scientific Method Prepare a Proposal (#9) Describe all aspects of the research –Steps 1-8
 Describe all aspects of the research –Steps 1-8")
25
Scientific Method Peer Review and Proposal Revision (#10) We are “to close” Save time and $
 We are to close Save time and $")
26
Scientific Method Collect Data (#11) Care in data recording –Avoid personal bias “Fun” and boredom 20% of process
 Care in data recording –Avoid personal bias Fun and boredom 20% of process")
27
Scientific Method Data Analysis (#12) Take the classes
 Take the classes")
28
Scientific Method Evaluation and Interpretation (#13) Avoid expectations of results and personal bias Organize results concisely and clearly in relation to objectives and hypotheses being tested
 Avoid expectations of results and personal bias Organize results concisely and clearly in relation to objectives and hypotheses being tested")
29
Scientific Method Evaluation and Interpretation (#13) Questions –Do (statistical) tests support one or more hypotheses? –Do the results reasonably explain the biology? e.g., r & P-value in SLR –Are there alternative explanations? –Are there any problems with the data? Small sample size Unusual variation Are additional data needed?

30
Scientific Method Evaluation and Interpretation (#13) Conclusions Differentiate between conclusions based on the data and speculation
 Conclusions Differentiate between conclusions based on the data and speculation")
31
Scientific Method Speculation and New Hypotheses (#14) New directions for better understanding –Limit in publications
 New directions for better understanding –Limit in publications")
32
Scientific Method Publication (#15) Knowledge is “wasted” without dissemination Clear and concise writing –Repeatability Traumatic experience –Ego Helpful –Researchers are “to close” The process
 Knowledge is wasted without dissemination Clear and concise writing –Repeatability Traumatic experience –Ego Helpful –Researchers are to close The process")
33
Scientific Method Repeat the Process (#16) New hypotheses New design and methods
 New hypotheses New design and methods")
34
Research Components Populations Population: a group of interbreeding individuals in the same place at the same time 3 types –Biological –Political –Research Complete vs. sample Conclusions based on population studied

35
Research Components Populations Does the sample represent the research population? Does the research population represent the biological population?

36
Research Components Populations How well does the biological population represent the species? Unless all of these can be answered, conclusions from research must be limited to the proper scope

37
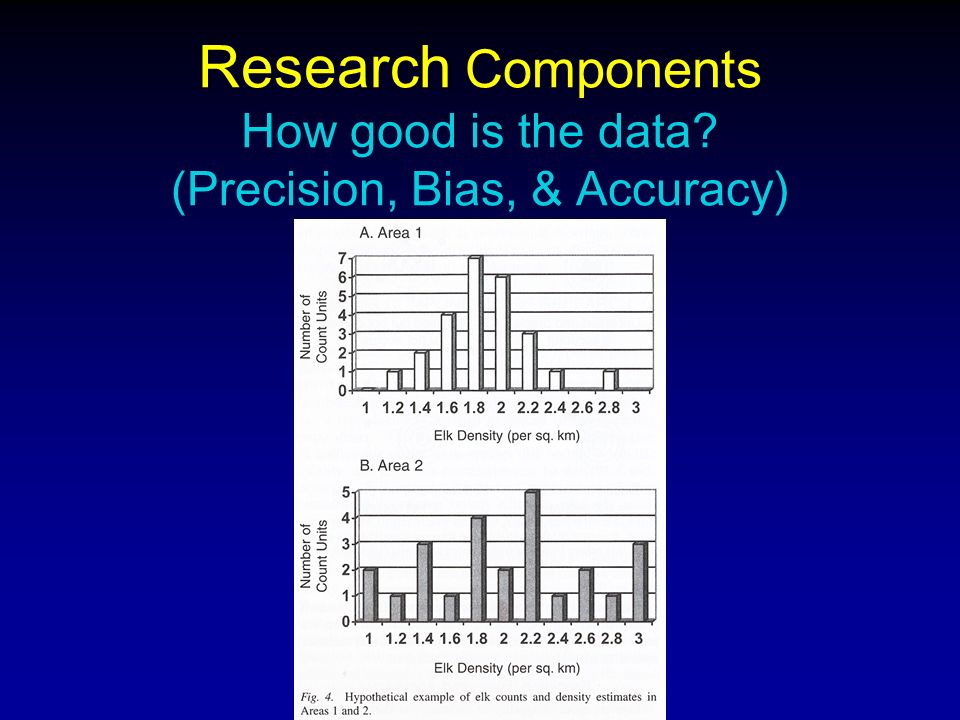
Research Components How good is the data? (Precision, Bias, & Accuracy)
")
39
Research Components Replication Sample size: the number of independent sample (experimental) units drawn from the research population (i.e., number of replicates) –Often random Subsample: the number of observations in a sampling (experimental) unit
 units drawn from the research population (i.e., number of replicates) –Often random Subsample: the number of observations in a sampling (experimental) unit")
40
Research Components Replication The precision of a statistic (e.g., mean) is measured by its standard error (SE) Standard error depends on the variation in the original measurements (samples) and sample size
 is measured by its standard error (SE) Standard error depends on the variation in the original measurements (samples) and sample size")
41
Research Components Replication These measurements must be true replicates (i.e., independent sample from the population) or the sample variation will underestimate the actual amount of variation in the population, and the precision of our estimate (e.g., mean) will be over-estimated.
 or the sample variation will underestimate the actual amount of variation in the population, and the precision of our estimate (e.g., mean) will be over-estimated.")
42
Research Components Replication and Randomization BurnedUnburned PseudoreplicationReplication Burned Unburned What is “treated” ?

43
Research Components Replication Why subsample?

44
Research Components Controls What are they? –Control vs. treatment Why are they needed? Experimental control

45
Research Components Sample Size How many samples are enough? –Depends on variability (precision) of your data –Power of tests to be employed –Sample size calculations
 of your data –Power of tests to be employed –Sample size calculations.")
46
Research Components Sample Size How do you estimate variability prior to doing the study? –Pilot study –Literature review

47
Research Components Sample Size Why do we need to increase sample size? –Prevent the drawing of erroneous conclusions Better describe the population –Improve the power of our tests

48
Research Components Power

49
Determinants –Sample size –Type I error (α) 0.05 –Effect size –Statistical test Uses –Sample size –Interpretation of statistical tests
 0.05 –Effect size –Statistical test Uses –Sample size –Interpretation of statistical tests")
50
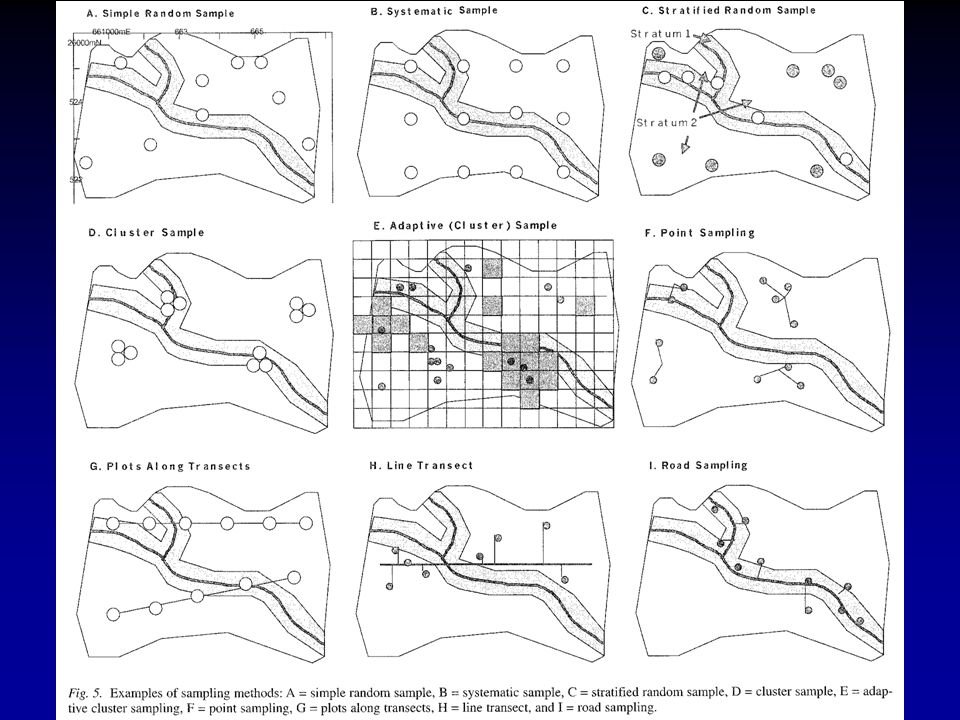
Research Components Sampling Design

52
Sequential

53
Sampling Dependent and Independent Samples

54
Research & Experimental Design Study Design Alternatives to hypothesis testing Common problems The research-management connection

55
Study Design Hypothesis Testing

56
Field studies –Mensurative or observational experiments Natural experiments Field experiments

57
Study Design Hypothesis Testing Laboratory experiments –Scale, scope, realism, & generality Impact assessment –Before-after/control-impact (BACI)
")
58
Study Design Hypothesis Testing Integrated Research Processes –Descriptive studies & field/natural history observations –Experiments Natural, field, & lab

59
Study Design Hypothesis Testing

60
Necessities in Manipulative Experiments Specify the research population Replication Proper use of controls (Random) assignment of treatments to experimental units
 assignment of treatments to experimental units")
61
Thing’s to consider when designing experiments What is the hypothesis to be tested? What is the response/dependent variable(s) and how should it be measured? What is the independent/treatment variable(s) and what levels of the variable(s) will be tested? To which population do we want to make inferences?
 and how should it be measured. What is the independent/treatment variable(s) and what levels of the variable(s) will be tested. To which population do we want to make inferences .")
62
Thing’s to consider when designing experiments What is the experimental unit? Which experimental design is best? How large should the sample size be? Have you consulted a statistician and had your design reviewed?

63
Single vs. Multifactor Designs SLR vs. MLR Single-factor vs. multi-factor ANOVA –Interactions

64
Dependent Experimental Units Lack of independence (Pseudoreplication) –Fix Paired designs Blocks Repeated measures
 –Fix Paired designs Blocks Repeated measures")
65
Alternatives to Hypothesis Testing

66
Common Problems Sample Size & Power Procedural inconsistency Non-uniform treatments Pseudoreplication*

67
The Research-Management Connection Science-based management decisions –Problem: a lack of research on program effectiveness Adaptive Management

Similar presentations


![Introduction to Ecology [BIO 3510]](/24/7453334/big_thumb.jpg "Introduction to Ecology [BIO 3510]>")

