Download presentation
Presentation is loading. Please wait.

1
A MULTIVARIATE FEAST AMONG BANDICOOTS AT HEIRISSON PRONG Terry Neeman, Statistical Consulting Unit, ANU Renee Visser, Fenner School of Environmental Science, ANU

2
Playing it safe with multivariate analysis Multivariate analysis for observational data Pattern-seeking Avoids hypothesis testing No searching across thousands of potential covariates for a few interesting “drivers” of response No commitments Data-driven

3
The western barred bandicoot of Heirisson Prong Once common on mainland Australia Driven to extinction in 1930s Small population on Dorre Island Re-introduced to Western Australian peninsula- Heirisson Prong – 1995 Subject of ecological research

4
Studying the bandicoot diet at Heirisson Prong Analysis of faecal samples 40 animals captured in summer, 33 animals captured in winter Invertebrate and plant matter identified from reference collection Relative volume of each diet item 7 most common invertebrates used for diet analysis Data issues unidentified material uninteresting material classification of material taxonomic categories Size categories

5
Sample Data – relative volume (%) (Subset of total columns) IDSeasonBeetle Grass- hoppersSpiderSlaterBugsAnts Scor- pions 1W70010000 14W2018000100 44W1027001600 49W283700000 34S000321440 76S150000778 165S156200594 164S187000120 246S180031000 etc
 (Subset of total columns) IDSeasonBeetle Grass- hoppersSpiderSlaterBugsAnts Scor- pions 1W W W W S S S S S etc")
6
Assessing prey availability at Heirisson Prong Pitfall traps used to capture invertebrates Sampled 7 days in winter and 7 days in summer 14 randomly selected quadrants (50x50m) on 2 sites Vegetation type: open ground, nesting area, common shrubs, other Counts amalgamated by veg type: 8 sets for each season 7 most common invertebrates counted
 on 2 sites Vegetation type: open ground, nesting area, common shrubs, other Counts amalgamated by veg type: 8 sets for each season 7 most common invertebrates counted")
7
Prey Availability Invertebrate counts by area SeasonBeetlesAnts Grass- hoppersSlatersBugsScorpions winter272538090 winter244221062 summer 410751305 summer 2012236120 summer 12201412711 Etc…

8
A multivariate feast of questions…. Does bandicoot diet vary between winter & summer? What are the patterns of diet observed? Does prey availability vary between winter & summer? How does prey availability by season influence diet? What are the bandicoot diet preferences?

9
Tools available in multivariate analysis Correspondence analysis Decomposition of profile matrix of contingency table Generalised singular value decomposition Principal components analysis Decomposition of centred data matrix Row and column analysis not symmetric Cluster analysis Non-hierarchical Hierarchical

10
Data issues – which data do we analyse? Relative volume data As compositional data (what about all the zeros?) Aggregate categories? Subset of relative volume data Standardised to sum to 100? Presence/absence data Relative volume data - ranked Rank the diet items within each animal Total ranks across animals Massage it to look more multivariate normal?
 Aggregate categories. Subset of relative volume data Standardised to sum to 100. Presence/absence data Relative volume data - ranked Rank the diet items within each animal Total ranks across animals Massage it to look more multivariate normal .")
11
Univariate analysis of bandicoot diet – presence / absence data SummerWinter χ2χ2 P-value (n=40)(n=33) Beetles83%100%6.390.01 Grasshoppers48%91%15.4<0.001 Ants98%33%34.5<0.001 Slaters35%9%6.80.012 Bugs33%24%0.6 Spiders38%15%4.540.04 Scorpions30%6%6.690.02
(n=33) Beetles83%100% Grasshoppers48%91%15.4<0.001 Ants98%33%34.5<0.001 Slaters35%9% Bugs33%24%0.6 Spiders38%15% Scorpions30%6%")
12
Correspondence analysis for invertebrate orders We use relative volume data - treat data as “counts” data 73x7 matrix Correspondence analysis weighted PCA on rows and on columns Row and column scores are computed. Column scores give a lower-dimensional representation of diet patterns across animals Row scores give a lower-dimensional representation of diet patterns within an individual Ordering the data based upon the first row score, and the first column score gives a visual pattern of association between rows and columns.

13
Relative volume of invertebrate item in faeces (volume <10% removed from table) Seas onScorpions Grass- hoppersSpidersBeetlesAntsBugsSlaters s 1552 s 1432 s 1831 s 1637 w 10 s 2936 s 142447 s 181234 s 4229 w 241211 s 2217 s 96 w1018 s12 47
 Seas onScorpions Grass- hoppersSpidersBeetlesAntsBugsSlaters s 1552 s 1432 s 1831 s 1637 w 10 s 2936 s s s 4229 w s 2217 s 96 w1018 s12 47")
14
… a second summer population … seasonScorpions Grass- hoppersSpiders BeetlesAnts BugsSlater s 2217 s 96 s12 47 s 91 s342226 s 55 s 83 s1577 s 12 s3318 s1559 s1761

15
Beetles and Grasshoppers in winter…. seasonScorpions Grass- hoppersSpidersBeetlesAntsBugsSlaters s10 12 s34102611 w 1622 w 1728 s 223611 w 182010 w 1118 w 2033 w 2631

16
Correspondence Analysis cumulative inertia - 55%

18
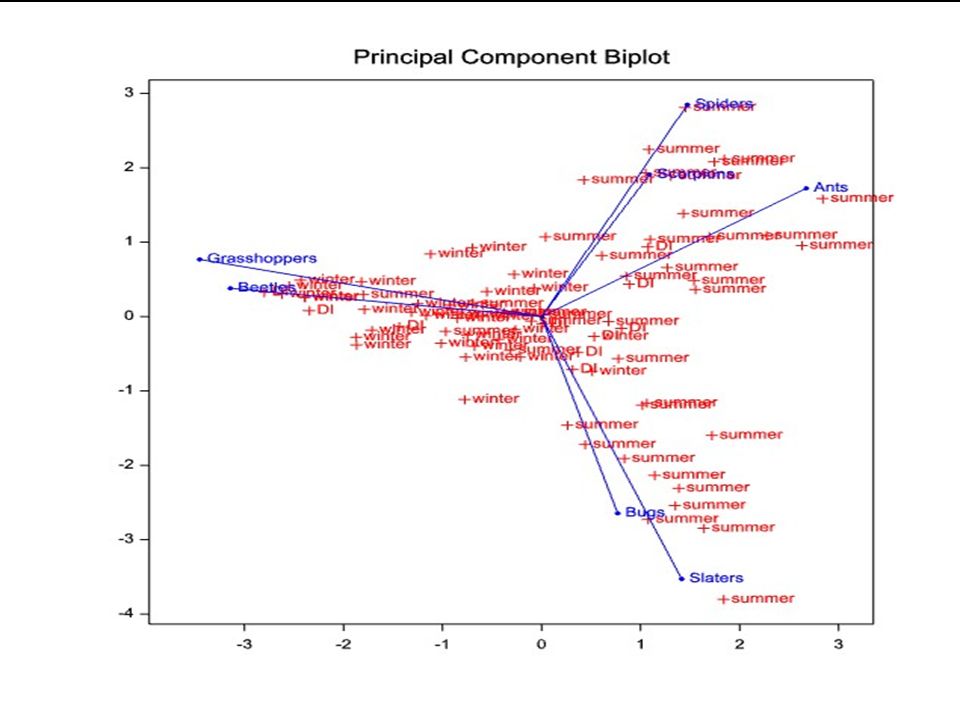
Principal components analysis - GenStat Latent roots12 555.1 215.2 Percentage variation12 50.89 19.73 ~70% total variation Latent vectors (loadings) 12 Spiders -0.03597 0.01639 Beetles 0.20709 0.29857 Bugs 0.01418 -0.11255 Ants -0.94719 0.19473 Slaters 0.00686 -0.75247 Grasshoppers 0.23982 0.54203 Scorpions -0.02982 0.00088
 12 Spiders Beetles Bugs Ants Slaters Grasshoppers Scorpions")
19
Non-hierarchical clustering using k-means Beetles Grasshoppers n=40 Slaters Bugs n=14 Ants Spiders Scorpions n=19 WINTER SUMMER

20
Hierarchical clustering using complete linkage

21
Prey availability: counts of captured prey in pit traps

22
Prey availability: Correspondence Analysis counts below 5 removed -13/16 sites slaterantsscorp Grass- hopperbeetlespiderbugs W251627389 W281436318 W291221316 W33194020 W43164227 W45124021 W42624216 W46 928 S6619717 S 5997 S 5118 S1347235 S13107565

23
Prey availability: Correspondence Analysis counts below 5 removed –summer sites SlaterAntsScorp Grass- hopper BeetleSpiderBugs S6619717 S 5997 S 5118 S1347235 S13107565 S6112220 S801031711 S127201612

24
Correspondence Analysis - biplot Winter sites: 1 – 8 Summer sites: 9 - 16

26
Non-hierarchical clustering: Standardise each variable first! Spiders Beetles Bugs N=8 Ants Slaters N=8 Scorpions Grasshoppers WINTER SUMMER

27
Hierarchical cluster analysis of prey availability

28
A univariate look at matching prey availability to diet Presence / absence in pit-traps and faecal samples WINTER

29
A univariate look at matching prey availability to diet Presence / absence in pit-traps and faecal samples SUMMER

30
Food availability ranked by total count SUMMER 1.Ants 2.Slaters 3.Grasshoppers 4.Beetles 5.Spiders 6.Bugs 7.Scorpions WINTER 1.Ants 2.Beetles 3.Spiders 4.Grasshoppers 5.Bugs 6.Scorpions 7.Slaters Using relative volumes, diet items are ranked for each individual Subtract diet rankings from food availability rankings Positive numbers indicate preference for that food item

31
Average rank differences rank order preference Invertebrate itemSummerWinter average rank difference (n=40)(n=33)(n=73) Beetles1.20.50.9 Ants-3.5-2.1 Grasshoppers-1.42.10.2 Spiders0.2-2.0-0.8 Slaters-2.51.9-0.5 Bugs1.20.30.8 Scorpions2.30.81.6
(n=33)(n=73) Beetles Ants Grasshoppers Spiders Slaters Bugs Scorpions")
32
Double-bootstrap to get confidence intervals For each iteration (N=1000) Sampled (with replacement) 8 summer traps, 8 winter traps Rank prey using totals from re-sampled data Sampled (with replacement) 40 summer animals, 33 winter animals Rank diet items for each re-sampled animal Take difference for each animal: Prey rank – diet item rank For each diet item, calculate average difference across animals 5% and 95% quantiles of distribution for each diet item
 Sampled (with replacement) 8 summer traps, 8 winter traps Rank prey using totals from re-sampled data Sampled (with replacement) 40 summer animals, 33 winter animals Rank diet items for each re-sampled animal Take difference for each animal: Prey rank – diet item rank For each diet item, calculate average difference across animals 5% and 95% quantiles of distribution for each diet item")
33
Average rank preferences with bootstrapped confidence intervals

34
A few conclusions A multivariate approach gives a richer picture Profile animals and diet items – look at diet patterns Non-hierarchical cluster analysis, correspondence analysis and PCA elucidate similar patterns Hierarchical clustering is too hard to interpret Rank preference index used to assess diet selectivity Double bootstrapping prey and diet data can give confidence intervals

35
References Visser R, Richards J, Neeman T., Diet of the endangered Western Barred Bandicoot Perameles bougainville (Marsupialia: Peramelidae) on Heirisson Prong, Western Australia, Wildlife Research, in press. Krebs C., Ecological Methodology, Addison-Wesley 1999

Similar presentations


 Lutgarde Buydens, IMM, Analytical Chemistry.>")

 and Related Techniques From: McCune, B. & J. B. Grace. 2002. Analysis of Ecological Communities.>")
 for Clustering Gene Expression Data K. Y. Yeung and W. L. Ruzzo.>")


 for Clustering Gene Expression Data K. Y. Yeung and W. L. Ruzzo.>")