Download presentation
Presentation is loading. Please wait.

1
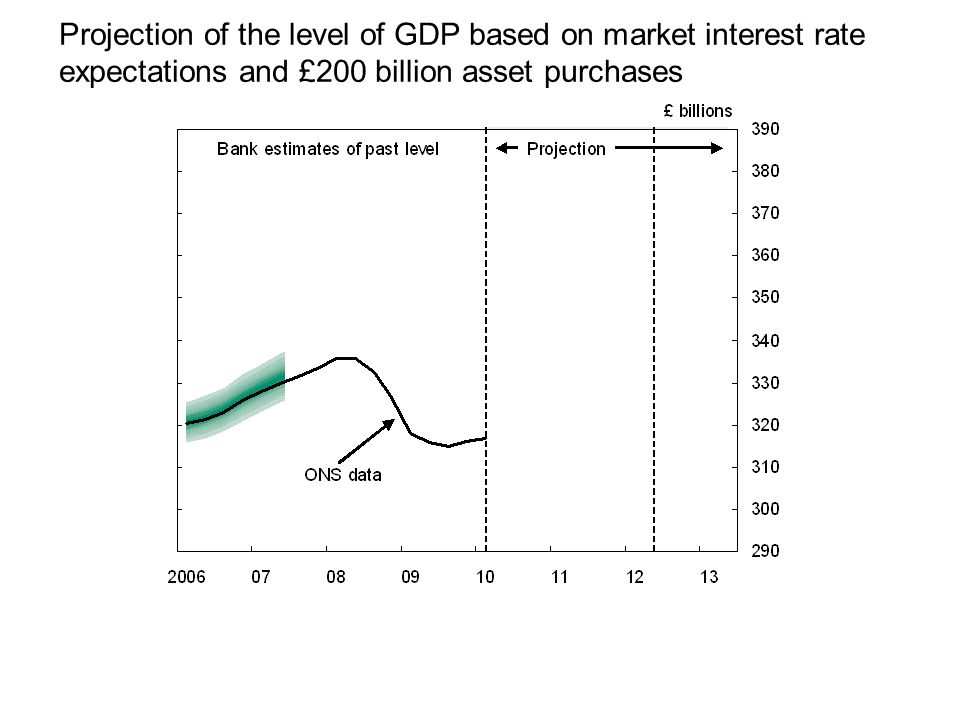
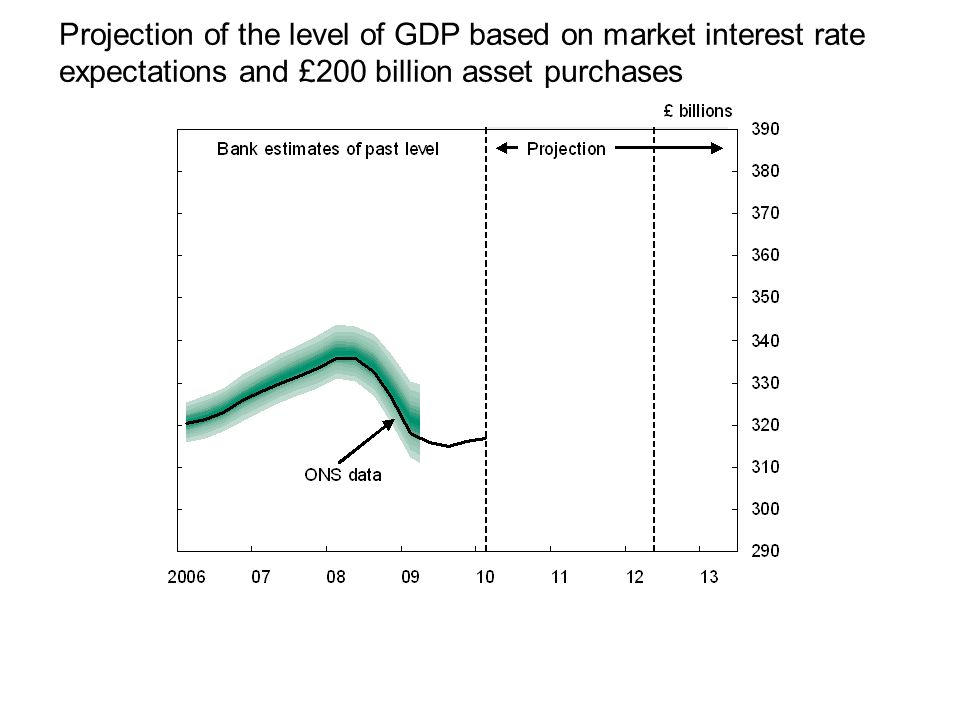
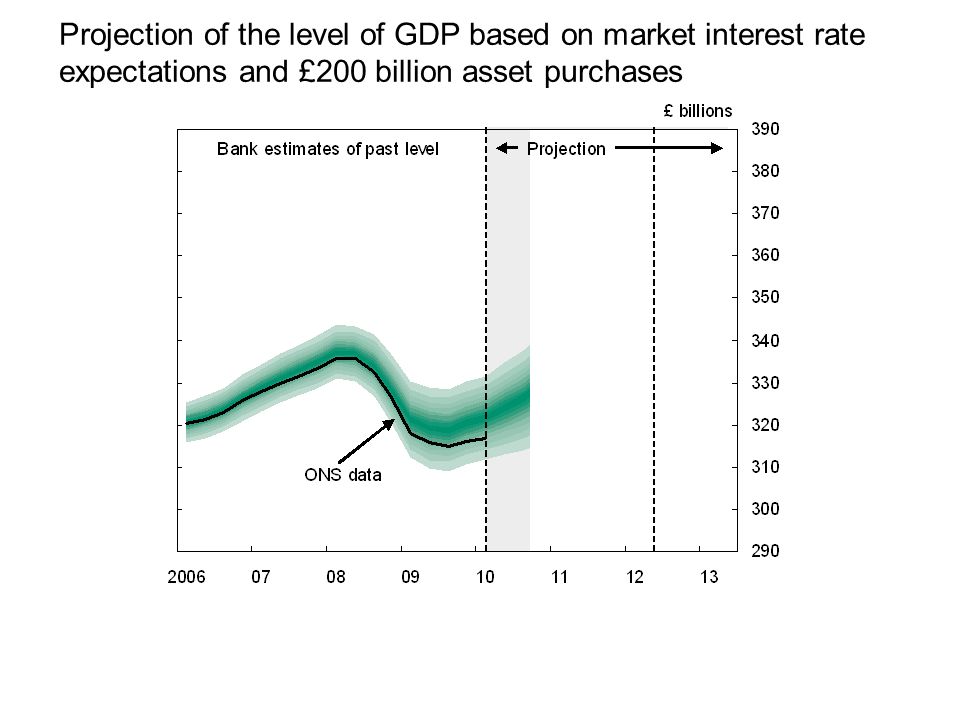
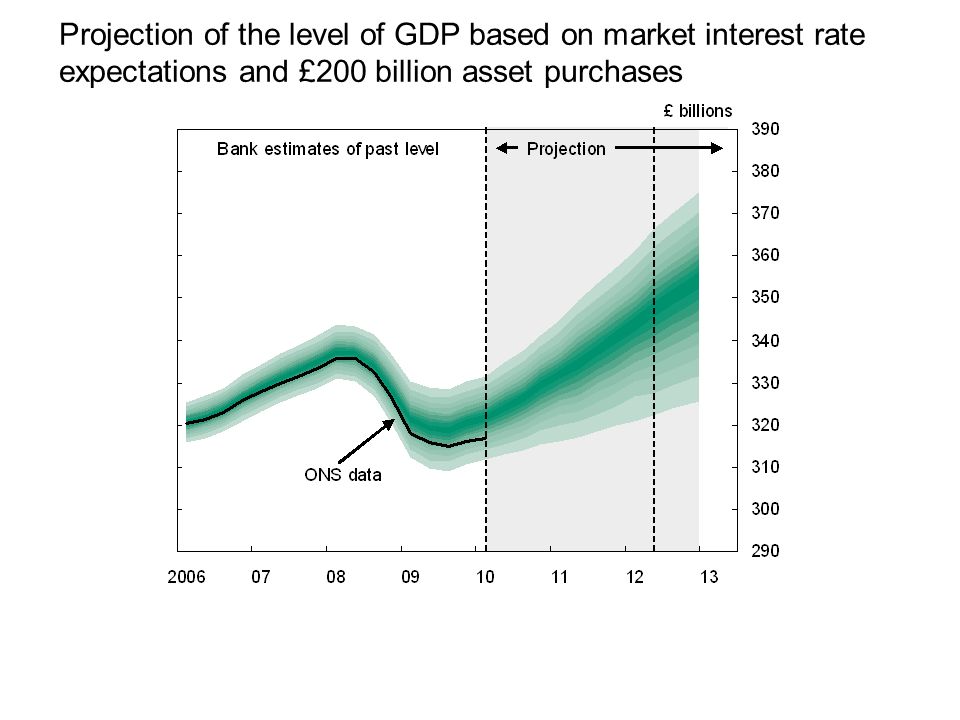
Animated fan chart for level of GDP: May 2010 As a part of his March 2010 speech to the Royal Society, the Governor showed an animated version of the February 2010 inflation fan chart.speech to the Royal Society This slideshow presents the equivalent animation for the May 2010 projection for the level of GDP conditioned on market interest rate expectations and £200 billion of asset purchases. Press any key to begin the animation.

2
Projection of the level of GDP based on market interest rate expectations and £200 billion asset purchases

Similar presentations


 1000 2000 3000 4000 5000 6000 7000 8000 9000 1950196019401930197019902000.>")


