Download presentation
Presentation is loading. Please wait.

1
FY 2011 Assessment of Financial Strength Arizona Board of Regents Enterprise Initiatives, Finance and Strategic Planning Committee December 1, 2011 Finance Committee Item #1 December 1, 2011

2
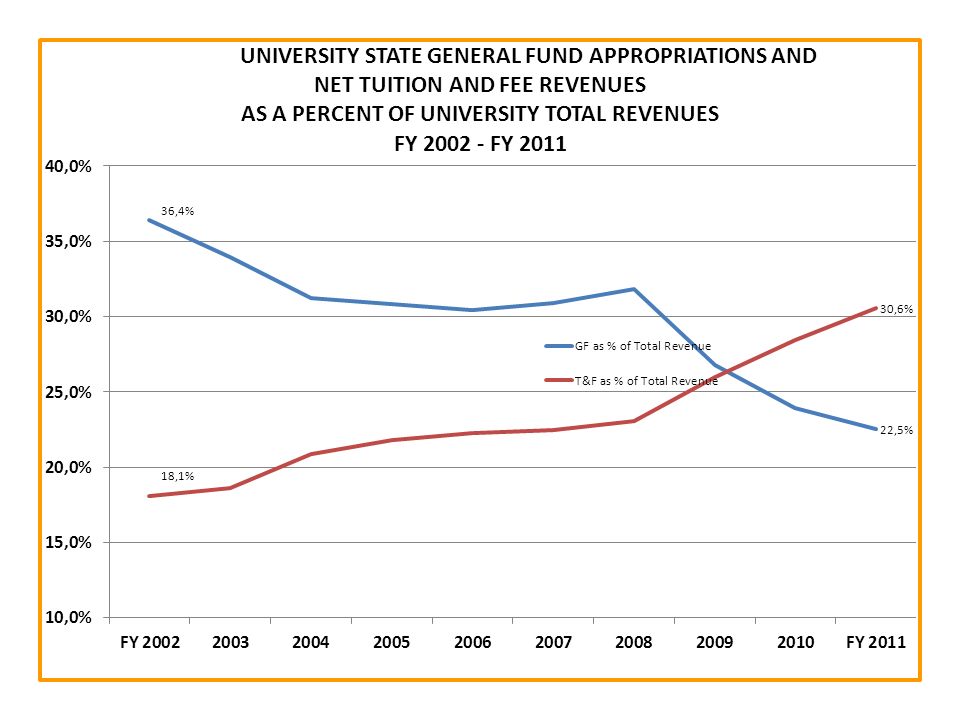
Summary of FY 2010-11 Fiscal Performance Enrollments continue to be strong – Freshmen – Community College Transfers – Increase in Retention Balance Sheets improved at all three institutions – Increase in Net Assets – Balance sheet liquidity at ASU & UA remains thin E & G Revenue and Expense Trends – 2011 compared to 2010 – increases in total expenditures, and expenses per FTE – Continued to show productivity gains from 2008 The percentage of state support to total revenue continued to decline

3
University Annual Financial Statements – Net Assets All three universities experienced positive growth in their net assets SCHEDULE OF TOTAL NET ASSETS (in millions) FY 2010FY 2011Change% Change ASU $ 1,036.8 $ 1,130.4 $ 93.69% NAU $ 368.8 $ 417.9 $ 49.113% UA $ 973.6 $ 1,069.1 $ 95.510% SYSTEM TOTAL $ 2,379.2 $ 2,617.4 $ 238.2 10%
 FY 2010FY 2011Change% Change ASU $ 1,036.8 $ 1,130.4 $ 93.69% NAU $ $ $ % UA $ $ 1,069.1 $ % SYSTEM TOTAL $ 2,379.2 $ 2,617.4 $ %")
4
Drivers of Increases in Net Assets Reducing Costs and Restructuring Accelerated growth in tuition and fees and research revenue Improved financial markets – increase in investment income

5
Education & General Revenue and Expense Trends Total revenues and expenditures (net of scholarship expenses) both increased in FY 2011 – Total system revenues increased by $104M or 5.2% – Total system expenditures increased by $132M or 6.9% – Enrollment growth – 5,210 FTE or 4.2% FY 2011 vs. FY 2008 – Revenues increased $196M or 9.8% – Expenses increased $113M or 5.9% – Enrollment growth – 16,708 or 14.7% – FTE Basis Revenues decreased $(640) per student or (3.8%) Expenses decreased $(1,327) per student or (7.8%) Scholarship expenses continue to increase
 per student or (3.8%) Expenses decreased $(1,327) per student or (7.8%) Scholarship expenses continue to increase.")
6
Composition of the University’s Revenue FY 2011 RATIOS ASUNAUUA 23%30%20%

7
Composition of the University’s Revenue FY 2011 RATIOS ASUNAUUA 38%32%23%

8
Composition of the University’s Revenue FY 2011 RATIOS ASUNAUUA 26%23%41%

10
Ratios to Measure Financial Strength of the Balance Sheet Ratios 7 & 8 measure flexibility Ratio 9 measures debt service Ratios 7, 8 & 9 are key ratios used by rating agencies to determine bond ratings

11
Rating Agencies Independent fiscal analysis of universities Impact ability to borrow and levels of debt service 5 Factors in Determining Rating Assessment – Market Position – Operating Performance – Balance Sheet and Capital Investment – Governance and Management – Legal Security and Debt Structure

12
University Bond Ratings ASUNAUUA Moody's SPEED Revenue BondsA1A2Aa3 System Revenue BondsAa3A1Aa2 OutlookStable Negative S & P SPEED Revenue BondsAA-A System Revenue BondsAAA+AA- OutlookNegativeStable

13
Reasons for Negative Outlook Ongoing reductions in State Appropriations Political and market pressure to limit tuition increases Thin unrestricted liquidity to cover expenses

14
What Could Move the Rating Up Significant growth of liquid financial resources Stabilization of state funding Improved credit profile of the state

15
What Could Move the Rating Down Declines in unrestricted liquidity and/or further deterioration of financial strength ratios Inability to manage through a challenging state funding environment Additional borrowing without commensurate growth of financial resources and revenues to pay debt service Deterioration of the credit quality of the State

16
Reserve Policy Requested by Board CFO’s examining options Liquidity – ASU has a ratio of 22.3%, or less than 12 weeks of liquid assets to cover expenses – UA has a ratio of 18.8%, or approximately 10 weeks of liquid assets to cover expenses – NAU has a healthy liquidity ratio of 44.8% or approximately 23 weeks of liquid assets to cover expenses Delicate Balance

Similar presentations