Download presentation
Presentation is loading. Please wait.

1
Ch 4 Graphs Main topic-How can you appropriately display data

2
4.1 Categorical variables Key Q-How do you construct and read graphs?

3
Categorical Variables (Categories, classes, topics, intervals) Categories may be numerical or not. Education -Less than HS grad. -HS grad. -Some secondary education. -Secondary degree. -Advanced degree. House Size -2000 to 2500sqft -2501 to 4000sqft -4001 to 6000sqft

4
Frequency Tables 50-591 60-693 70-798 80-8913 90-996 Mr. Booth’s grades (in percent) Rules for quantitative frequency tables 1.Interval should be the same size. 2.No skipping intervals. 3.No overlapping. 4.*Make them nice.*
 Rules for quantitative frequency tables 1.Interval should be the same size. 2.No skipping intervals. 3.No overlapping. 4.*Make them nice.*.")
5
Blue8 Green3 Red7 Yellow10 Black3 Other14 Favorite Color 100-1995 200-2993 300-3990 400-4990 500-59918 600-69917 700-7993 Miles traveled during the summer. (in miles)
.")
6
Pie Chart (Circle Chart) Used to compare a whole on one topic. Needed to construct a pie chart. 1.Percents 2.Degrees

7
Blue8 Green3 Red7 Yellow10 Black3 Other14 Favorite Color

8
Bar Graph Strictly categorical variables.

9
Classes are not connected. Show this by not connecting the bars.

10
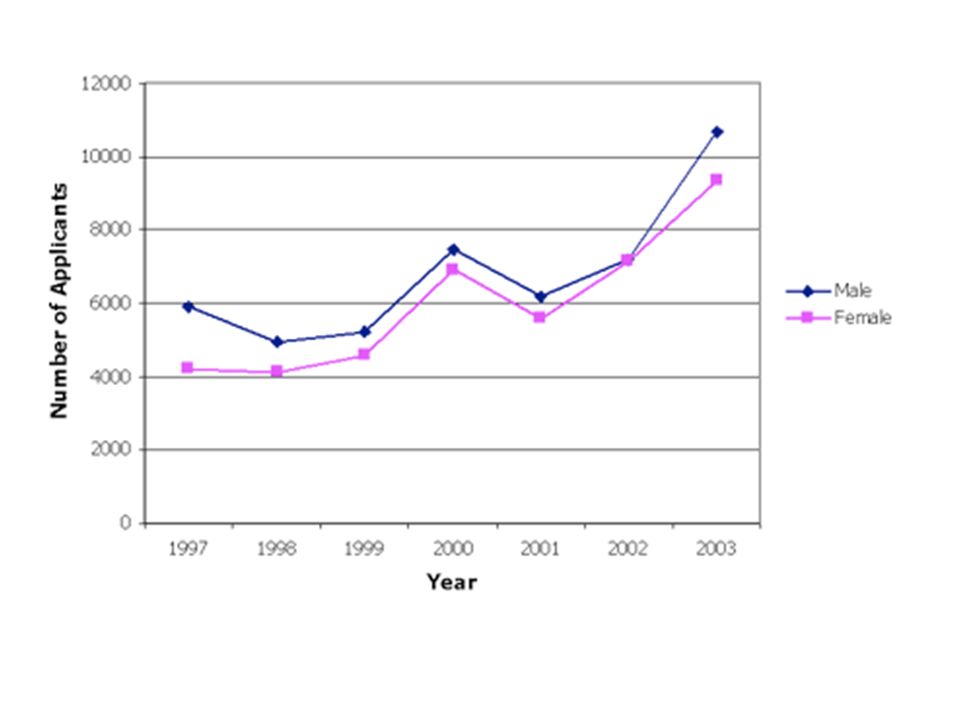
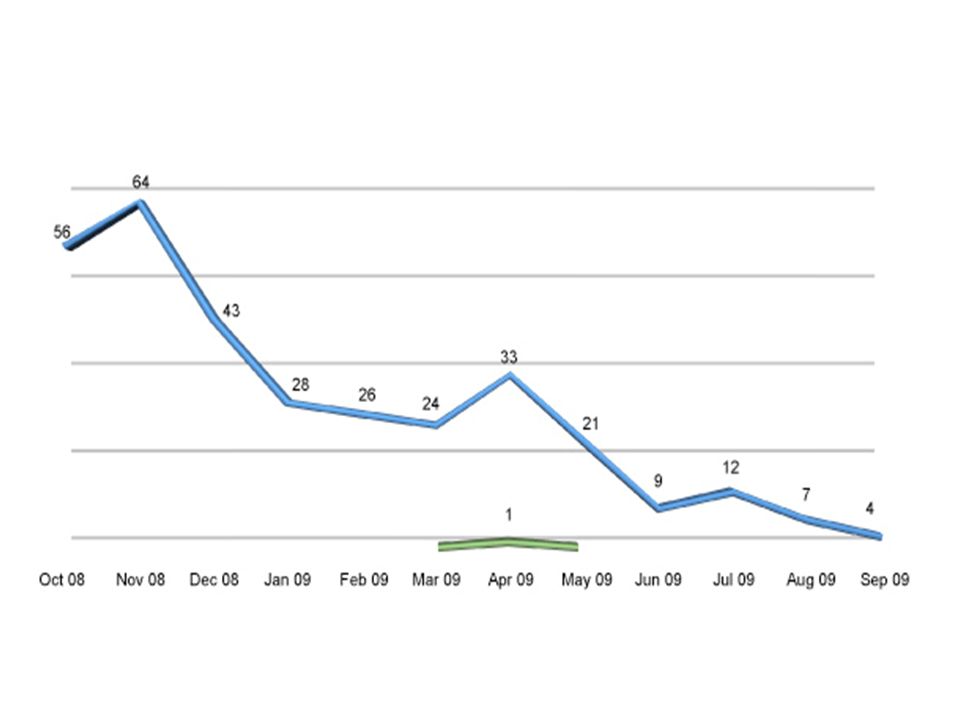
Line Charts Best graph for showing change over time.

13
Trend A pattern of increase or decrease. Big picture view point.

15
Seasonal Trend A pattern that occurs every year.

17
Rules for all graphs 1. Must have labels, a title, and a key or legend. 2. Data must standout.

Similar presentations


 Label it. When would you use a line.>")

