Download presentation
Presentation is loading. Please wait.

1
MATHEMATICAL MODELLING FOR POLLUTION ASSESSMENT IN AQUATIC ENVIRONMENTS OF MYSORE DISTRICT N.S. VEERESHA KUMAR, SHANKAR P.HOSMANI Department of studies in Botany, University of Mysore, Manasagangotri, Mysore– 570 006 India E-mail: veeresh_kanamadugu@rediffmail.com

2
ABSTRACT. The importance of PCA as an appropriate tool for water quality assessment has been greatly emphasized. This method can be applied to eutrophication processes and physico-chemical and biological variables. This phenomenon modifies the state of equilibrium of the aquatic medium and therefore a change in every relation linkage analytical variable appears. By computation of a principal component analysis made with correlation coefficient takes into account these changes and becomes an easy and appropriate tool for the description of the lake parameters. A detailed idea of the status of pollution of any water body is of much importance because it keeps in proper management of these waters. The result of the mathematical modelling for pollution assessment in the two lakes under study indicates that Chikka Hunsur lake is more polluted with less diversity and ranges from a weak eutrophic nature to highly eutrophic nature; occasionally becoming moderately polluted. The diversity and frequency of plankton often go hand in hand; frequency of diatoms is high while other groups are less dominant, the dispersion of organisms is 11 % with single groups forming bloom resulting in pollution. In contrast Santhe lake is less polluted with more diversity and ranges from oligotrophic to weak eutrophic tending to be eutrophic during May when zooplankton increase in number. The Soyer’s frequency index and Bellan Santini’s dominance index are high and the dispersion is only 3 % with diatoms dominant. Therefore diversity indices, which constitute mathematical models, serve as important tools in pollution assessment of aquatic environments. Principal component analysis serves in identifying key toxic parameters and helps in proper modelling of lake ecosystems.

3
INTRODUCTION A detailed idea of the status of pollution of any water body is of much importance because it intimately keeps in proper management of these waters. A physico-chemical approach to monitor water pollution is most common but it provides a mosaic picture of the environment. Chemical analysis, although valuable and necessary, doses not provide all the information required in pollution assessment. It is not correlation of contaminants that are concerned but the effect of these on organisms. In such processes a key toxic chemical may be over looked and therefore a precise model applicable to the water body in study is most essential. In the present investigation, 2 water bodies have been selected. Various mathematical models, which are applicable to the water bodies, have been applied and the best suitable model is suggested. This will probably help in understanding the biodiversity and maintenance of lake ecosystem. The two water bodies selected for the present study are Santhe lake and Chikka Hunsur lake.

4
MATERIALS AND METHODS The present study was carried out in the Santhe lake and Chikka Hunsur lake of Mysore district located at 12 º - 18 º N. latitude and 076º - 081º E. longitude. The physical features and other aspects of the lakes are described in Table 1. Sampling was done between January 2004 and December 2004 for 12 months. The samples were taken in 1 –litre plastic bottles. The water samples for plankton study were preserved by using 10 ml of Lugo’s iodine solution and examined under a compound microscope. The collection, preservation, enumeration and identification of plankton were made as described by Hosmani and Vasanth kumar (1996). The physico-chemical analysis of the water was carried out as per the standard methods APHA (1995) and Trivedy and Goel(1986). Further PCA was also done. This data provides brief but precise explanations of the inter–relationship of the various physico-chemical and biological parameters analyses. Using PAST statistical software program, data can be analyzed by multivariate analysis, PCA biplot obtained.
. The physico-chemical analysis of the water was carried out as per the standard methods APHA (1995) and Trivedy and Goel(1986). Further PCA was also done. This data provides brief but precise explanations of the inter–relationship of the various physico-chemical and biological parameters analyses. Using PAST statistical software program, data can be analyzed by multivariate analysis, PCA biplot obtained..")
5
RESULTS AND DISCUSSION The over all physico-chemical composition of both lakes are analysed and the major content in Chikka Hunsur lake is magnesium (38%) and chloride (20%), where as magnesium constitutes 60% and chloride is 10% in Santhe lake. Calcium content is same (9%) in both lakes. Nitrate is twice as much in Chikka Hunsur lake than in Santhe lake. Dissolved oxygen is 2% and BOD is 1%, on the contrary BOD is negligible and dissloved oxygen is 1%. Chlorophyll-a content is higher in Chikka Hunsur lake representing higher planktonic numbers in it. The feature of interest is that in both lakes, magnesium, calcium and chloride are the principal components. Iron and phosphate content seem to play a lesser role in maintaining the growth of plankton. Assessment of water quality has traditionally relied upon the water quality parameters and the phytoplankton and zooplankton. Many other studies have used multivariate techniques such as PCA and weighted averages to relate water chemistry to planktonic organisms. Other simpler methods of representing lake models based on phytoplankton and zooplankton composition to elucidate the community structure are Soyer’s index for frequency, Bellan and Santini’s quantitative dominance index, Shannon and Weaver diversity index, Pielou’s evenness index, Pearson’s correlation matrix, Boyd’s index and Nygaard’s algal index, correlation matrix, hierarchical cluster analysis and dendrograms also provide simple methods of lake modelling where abundant data are available.
 in both lakes. Nitrate is twice as much in Chikka Hunsur lake than in Santhe lake. Dissolved oxygen is 2% and BOD is 1%, on the contrary BOD is negligible and dissloved oxygen is 1%. Chlorophyll-a content is higher in Chikka Hunsur lake representing higher planktonic numbers in it. The feature of interest is that in both lakes, magnesium, calcium and chloride are the principal components. Iron and phosphate content seem to play a lesser role in maintaining the growth of plankton. Assessment of water quality has traditionally relied upon the water quality parameters and the phytoplankton and zooplankton. Many other studies have used multivariate techniques such as PCA and weighted averages to relate water chemistry to planktonic organisms. Other simpler methods of representing lake models based on phytoplankton and zooplankton composition to elucidate the community structure are Soyer’s index for frequency, Bellan and Santini’s quantitative dominance index, Shannon and Weaver diversity index, Pielou’s evenness index, Pearson’s correlation matrix, Boyd’s index and Nygaard’s algal index, correlation matrix, hierarchical cluster analysis and dendrograms also provide simple methods of lake modelling where abundant data are available..")
6
Standard methods have been adopted for the analysis of physico-chemical parameters. They include: pH, total dissolved solids, dissolved oxygen, free carbon dioxide, total alkalinity, carbonates, bicarbonates, total hardness, calcium, chloride, nitrate, phosphate, biochemical oxygen demand, magnesium, total acidity, sodium, iron and chlorophyll-a. Phytoplankton and zooplankton were also determined using standard methods prescribed and the collection, preservation, identification and enumeration has been given in detail. The results of physico-chemical parameters of both the lakes are presented in (Table-2 and 3). Various models of diversity indices (mathematical) have been analysed and the results subjected to statistical analysis to provide a brief but precise explanation of the inter-relationships of the various physico-chemical and biological parameters. MATHEMATICAL MODELS (DIVERSITY INDICES) Shannon and Weaver Index for Chikk Hunsur lake did not show significant differences, the evenness index reveals that the distribution of species throughout the year is regular. The diversity index and evenness index go hand in hand upto April but further deviate considerably. The Soyer’s frequency index indicated that Chikka Hunsur lake is dominated by diatoms only, 24% of the total plankton is dominated by diatoms only while 72% is occupied by all other groups and overall comparison of diversity indices are shown in (Table 4).
. Various models of diversity indices (mathematical) have been analysed and the results subjected to statistical analysis to provide a brief but precise explanation of the inter-relationships of the various physico-chemical and biological parameters. MATHEMATICAL MODELS (DIVERSITY INDICES) Shannon and Weaver Index for Chikk Hunsur lake did not show significant differences, the evenness index reveals that the distribution of species throughout the year is regular. The diversity index and evenness index go hand in hand upto April but further deviate considerably. The Soyer’s frequency index indicated that Chikka Hunsur lake is dominated by diatoms only, 24% of the total plankton is dominated by diatoms only while 72% is occupied by all other groups and overall comparison of diversity indices are shown in (Table 4)..")
7
Table 4 : Comparison of Diversity Indices Sl. No. IndexChikka Hunsur lakeSanthe lake 1 Shannon and Weaver diversity Index (1949) More polluted with less diversity Less polluted with more diversity 2 Nygaards Algal index I Chlorophycean indexWeak Eutrophic IICyanophycean indexWeak Eutrophic IIIDiatom IndexNil IVEuglenophycean indexEutrophic Weak Eutrophic VCompond Quotient (CQ)Highly eutrophicOligotrophic 3 Diversity index of Boyd (1981) IPhytoplankton< 3: Moderately polluted> 3 : Clean IIZooplankton< 3 : Moderately polluted< 3 : Heavily polluted 4 Pielous evenness index (1975) and Diversity index (1949) Both go hand in hand (Continuous pollution) Both deviate considerably (Occasionally polluted) 5 Soyer’s frequency indexHigh (Diatoms frequent) 6 Bellan – Santini quantative dominance index (DI%)(1969) Low High 7 Desperssion index %11 %3 % Table 4 : Comparison of Diversity Indices
 More polluted with less diversity Less polluted with more diversity 2 Nygaards Algal index I Chlorophycean indexWeak Eutrophic IICyanophycean indexWeak Eutrophic IIIDiatom IndexNil IVEuglenophycean indexEutrophic Weak Eutrophic VCompond Quotient (CQ)Highly eutrophicOligotrophic 3 Diversity index of Boyd (1981) IPhytoplankton< 3: Moderately polluted> 3 : Clean IIZooplankton< 3 : Moderately polluted< 3 : Heavily polluted 4 Pielous evenness index (1975) and Diversity index (1949) Both go hand in hand (Continuous pollution) Both deviate considerably (Occasionally polluted) 5 Soyer’s frequency indexHigh (Diatoms frequent) 6 Bellan – Santini quantative dominance index (DI%)(1969) Low High 7 Desperssion index %11 %3 % Table 4 : Comparison of Diversity Indices.")
8
In Santhe lake the evenness of species is also similar by the species diversity and species evenness are low. Dominance values of species also indicate that diatom species are more.The species richness and species evenness in both lakes does not differ significantly. The over all phytoplankton distribution in Chikka Hunsur lake showed that Bacillariophyceae (35%), Cyanophyceae and Desmidaceae (18%) each, Euglenophyceae (15%), Chlorococcales (14%). In Santhe lake Bacillariophyceae (53%), Chlorococcales (16%), Desmids (15%), Cyanophyceae (11%) and Euglenophyceae (5%). The diversity index of Boyd in Chikka Hunsur lake and Santhe lake indicates that both the water bodies are moderately polluted. The relative abundance of phytoplanktons is high, while the relative abundance zooplankton varied from a minimum of 24% to 40% in Santhe lake. In Chikka Hunsur lake the relative abundance of both plankton was high. Nygaards index, which utilized the total count of various algal groups, indicated that Santhe lake varied from oligotrophic to weak eutrophic where as Chikka Hunsur lake was eutrophic throughout the period of study. The Shannon and Weaver diversity index and Pielou’s evenness index for zooplankton showed a great variation in both lakes, and were maximum during the months of October. Further the diversity of zooplankton in Santhe lake is well marked as compared to Chikka Hunsur lake. ( Fig 1, 2, 3 and 4).
, Cyanophyceae and Desmidaceae (18%) each, Euglenophyceae (15%), Chlorococcales (14%). In Santhe lake Bacillariophyceae (53%), Chlorococcales (16%), Desmids (15%), Cyanophyceae (11%) and Euglenophyceae (5%). The diversity index of Boyd in Chikka Hunsur lake and Santhe lake indicates that both the water bodies are moderately polluted. The relative abundance of phytoplanktons is high, while the relative abundance zooplankton varied from a minimum of 24% to 40% in Santhe lake. In Chikka Hunsur lake the relative abundance of both plankton was high. Nygaards index, which utilized the total count of various algal groups, indicated that Santhe lake varied from oligotrophic to weak eutrophic where as Chikka Hunsur lake was eutrophic throughout the period of study. The Shannon and Weaver diversity index and Pielou’s evenness index for zooplankton showed a great variation in both lakes, and were maximum during the months of October. Further the diversity of zooplankton in Santhe lake is well marked as compared to Chikka Hunsur lake. ( Fig 1, 2, 3 and 4)..")
11
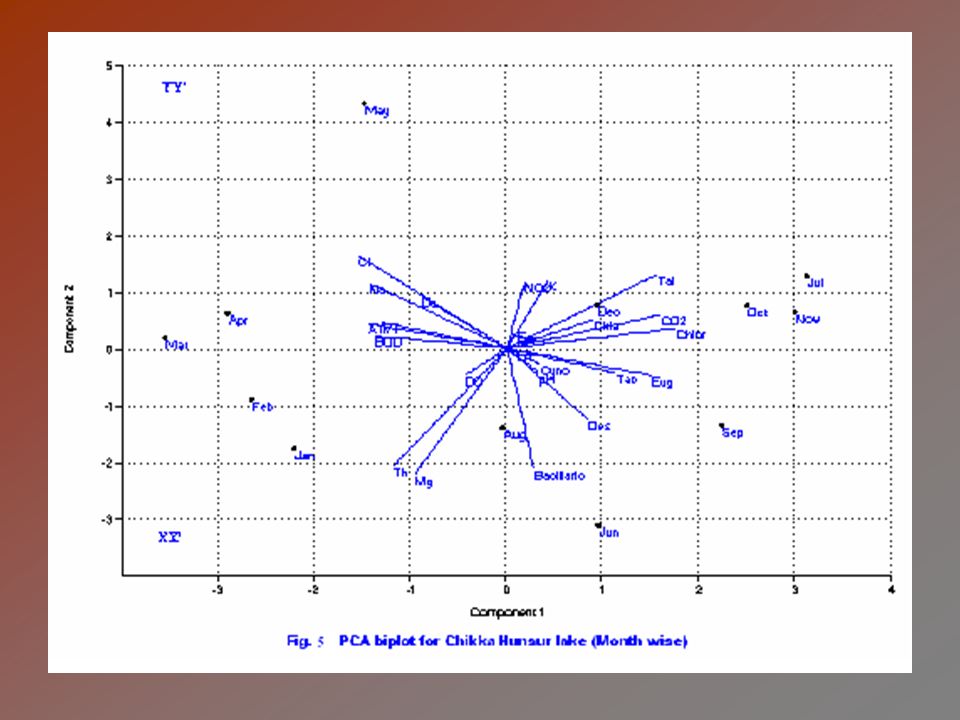
Another important mathematical model used is the Pearson’s correlation matrix, which leads to the classification of important clusters in hierarchy; dendrograms can be obtained to correctly represent the clusters or groups of parameters. In Santhe lake Bacillariophyceae and Desmidaceae constitute an important cluster while Euglenophyceae and Chlorococcales form another cluster, while the impact of physio-chemical parameters is less designated in Chikka Hunsur lake the physico-chemical parameters had a greater impact on Euglenophyceae. PCA was applied to the data to identify the important taxa related to physico-chemical analysis. Accordingly, again Bacillriophycae were the most dominant form in both the lakes. The dendrograms used as a mathematical model suggests that in Chikka Hunsur lake there are five important groups with the linkage between air temperature and Chlorococcales being the prominent factor, while in Santhe lake there are 4 groups of which chloride, bicarbonate and Cyanophyceae are the prominent factors. And Cyanophyceae and Chlorococcales are the most prominent groups in both lakes. Among all the models discussed so far the CCA/PCA (Canonical Correspondence Analysis) or Principal Component Analysis) biplot is the best model. It is possible to interpret the first important factor and the second factor in turn relate to biological activity of the lakes. For interpretation of the biplot the factor loadings for each variable on the unrotated component are taken into account. The length of the environmental line indicates the strength of the correlation with the ordination axis and its proximity to the axis indicates the degree of correlation. The biplot produced is a two dimensional entity where two components are taken into account. More than two component plotting appear over lapping in hyperspace and is difficult to analyze. (Fig. 4 and 5)
 or Principal Component Analysis) biplot is the best model. It is possible to interpret the first important factor and the second factor in turn relate to biological activity of the lakes. For interpretation of the biplot the factor loadings for each variable on the unrotated component are taken into account. The length of the environmental line indicates the strength of the correlation with the ordination axis and its proximity to the axis indicates the degree of correlation. The biplot produced is a two dimensional entity where two components are taken into account. More than two component plotting appear over lapping in hyperspace and is difficult to analyze. (Fig. 4 and 5).")
14
The overall consideration of the biplot in Chikka Hunsur lake, taking into account the length of the variables and their proximity to X and Y axis, total alkalinity, chlorophyll-a, and carbon dioxide control the growth of Chlorococcales and Euglenaceae to a greater extent and lower quantities of dissolved oxygen, chloride, sodium and BOD have an impact on Desmids and Bacillariophyceae; considering the monthly values Bacillariophyceae and Euglenophyceae were dominant and zooplankton formed a close coordination with phytoplankton.In Santhe lake the strength of the co- ordination was high among carbonates, BOD, chlorophyll-a, towards Cyanophyceae and Bacillariophyceae; phytoplankton and zooplankton also had a close co-ordination in Santhe lake also. And PCA biplot of both the lakes are shown in (Fig. 4 and 5). Among all the mathematical models studied in this investigation, the PCA model analysis serves as an appropriate tool for water quality evaluation. Other indices or models also support this model and all the data put together can be useful in monitoring pollution levels in these waters. Conclusion Biological indices represent mathematical models of community changes. Changes in water quality will affect resident biota, and indices that reflect these changes in a particular community are useful indication of water quality. The importance of PCA as an appropriate tool for water quality assessment has been greatly emphasized. This method can be applied to eutrophication processes and physico-chemical and biological variables. This phenomenon modifies the state of equilibrium of the aquatic medium and therefore a change in every relation linkage analytical variable appears. By continuation of a PCA made with correlation coefficient takes into account these changes and becomes an easy and appropriate tool for the description of the lakes.
. Among all the mathematical models studied in this investigation, the PCA model analysis serves as an appropriate tool for water quality evaluation. Other indices or models also support this model and all the data put together can be useful in monitoring pollution levels in these waters. Conclusion Biological indices represent mathematical models of community changes. Changes in water quality will affect resident biota, and indices that reflect these changes in a particular community are useful indication of water quality. The importance of PCA as an appropriate tool for water quality assessment has been greatly emphasized. This method can be applied to eutrophication processes and physico-chemical and biological variables. This phenomenon modifies the state of equilibrium of the aquatic medium and therefore a change in every relation linkage analytical variable appears. By continuation of a PCA made with correlation coefficient takes into account these changes and becomes an easy and appropriate tool for the description of the lakes..")
15
The method applied for the present study to the two lakes (Chikka Hunsur and Santhe lake) shows that a precise description could be made from a huge data of variables. It also shows that it is possible to simplify the description, without impairing its quality, by using a few important parameters, out of the 26 variables and a large list of phytoplankton and zooplankton that appeared in the lakes. In addition it is also possible to identify the allo-cathomous or auto- cathomous origin of variables. The model enables us to reduce the number of variables in determining the relation between physico-chemical and biological parameters in lake ecosystems. Interpretation of the data although principal component analysis using reduced number of variables, choosing global once like pH, dissolved oxygen, carbon dioxide, phosphate and nitrate explains that the significance of the components remains the same and the absence of one or two variables dose not act as the model. The result of the mathematical modelling for pollution assessment in the two lakes under study indicates that Chikka Hunsur lake is more polluted with less diversity and ranges from a weak eutrophic nature to highly eutrophic nature; occasionally becoming moderately polluted. The diversity and frequency of plankton often go hand in hand; frequency of diatoms is high while other groups are less dominant, the dispersion of organisms is 11% with single groups forming bloom resulting is pollution. In contrast Santhe lake is less polluted with more diversity and ranges from oligotrophic to weak eutrophic tending to be eutrophic during May when zooplankton increase in number. The frequency index and dominance index are high and the dispersion is only 3% with diatoms dominant. Therefore diversity indices, which constitute mathematical models, serve as important tools in pollution assessment of aquatic environments.

16
Thanking you

Similar presentations


 : No Discriminating power time and space ------------------->>")


>")


