Download presentation
Presentation is loading. Please wait.

1
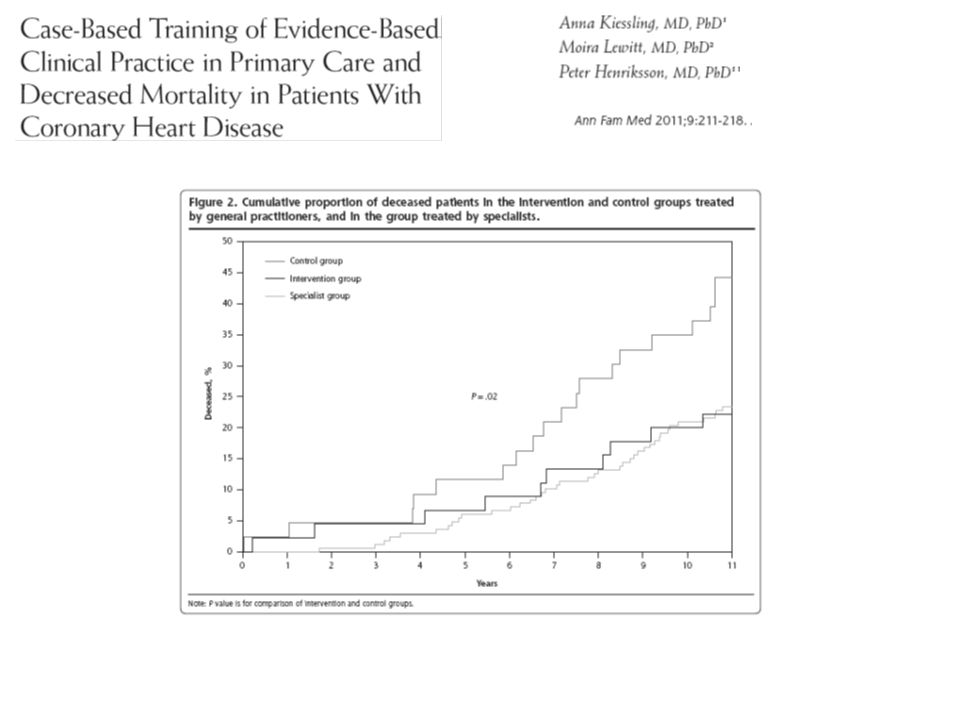
Quality follow up programme in primary care. Experiences from Västra Götaland what have we learned? Staffan Björck, Analysenheten, Regionkansliet, Västra Götalandsregion

2
Region Västra Götaland 1.5 mil. Inhab. 16% of Sweden Göteborg

3
Västra Götalandsregionen financing, primary care centres: Capitation, listed patients Age and gender ACG, adjusted clinical groups CNI, care need index Distance to hospital –P4P (quality) initially 3 % with aim to increase 4,3 % 2011
 initially 3 % with aim to increase 4,3 % 2011")
4
Number of patients with diabetes in regional database Effect of ACG on reporting of diagnoses 0 10 000 20 000 30 000 40 000 50 000 60 000 70 000 200520062007200820092010 patients

5
Current prevalence of atrial fibrillation in Västra Götaland Effect of ACG on reporting of diagnoses =2.44%

6
Follow up quality of care Identify indicators System for payment for performance How to do it? Learn from others Develop your own version

7
Learn from others –Reports on Swedish experiences –International experience

8
Most common Indicators for P4P in Sweden, Anell 2009 mått Counties n Adherence to drug recommendations11 Access by telephone10 Diabetic patients in national registry9 Patients visits to own centre9 Right choice of UTI antibiotics7 Prescription of physical activity5 Choice of least expensive BP lowering drug4 ”It is clear that there is a need for better follow up systems for primary care in Sweden and there is a great potential for cooperation between counties”

9
How to select indicators ? Q-indicators Payment Results to be made public Medical audit Useful information to centres Principles 1

10
Principles 2 Quality indicators –Automated data collection –Evidence based –Avoid ”how”, focus on results –As few as possible but enough to give meaningful information –Enough measures to spread economic risk

11
Principles 3 What do they do in primary care and what is important? Satisfaction, wait times, drug choice etc Chronic disease ≈ 50 % rare visitors ≈ 50 % chronic disease Number of doctors visits during 2 years

13
Quality indicators Primary care 29 14 5 13 8 8 2 1 4 3 9 1 5 3 19 2 9 6 141 Indicators Listed population characteristics Other statistics Chronic diseaseDiabetes Hypertension Ischemic heart disease Heart failure Stroke COP Asthma Psychiatric disorders Others Children's care Prevention Drugs Access to care Patient experience Organisation etc

14
Indicators, Diabetes Primary care registration results Indicator 1Registration national database 2Blood pressure 3Smoking 4HbA1c 5LDL-kolesterol 6Albuminuria 7Target for HbA1c 8 Target for HbA1c, recent onset 9 Target for Blood pressure 10 Target for LDL-cholesterol 11Patient education 12Integrated care 13Influenza immunisation

15
Principles P4P example diabetes High/low limits Weight LimitsRelative points Registration national database70-90 5 Registration blood pressure 80-95 0,5 Registration blood pressure 70-90 0,5 Registration HbA1c 80-95 0,5 Registration LDL-cholesterol 50-80 0,5 Registration albuminuri 70-90 0,5 Target for HbA1c 45-65 0,5 Target for blood pressure 30-50 0,5 Target for LDL-cholesterol- 35-50 1 sum 9,5 Principles –pay for registration –Relative weights –No sharp thresholds –Spread of economic risk + 4 other indicators without P4P

16
Differences vs NHS example –No exception reporting –Targets more difficult to reach –Much lower financial incentive –Focus on registration to give high quality feed back of results

17
0 10 20 30 40 50 60 70 80 percent Examples Results Influenza immunisation, patients 65+ Children with antibiotic prescriptions/ year P4P range Each dot = a primary care center, with confidence intervals

19
Webb access to results 160 000 patients

20
Main data sources –National diabetes registry –Regional Primary care quality registry –Drug prescription registry –Regional database for contacts –Swedish vaccination registry –Manual reporting

21
The regional primary care quality registry Automated data collection from local patient files –Ischemic heart disease –Hypertension –COP –Asthma –Diabetes Monthly update and back-reporting to centres

22
Interaction between diseases, primary care register Hypertension 198 238 Diabetes 65 730 Ischemic. Heart disease 44 317 58 % 9 % 14 % 6 % 1 % 3 % 8 % Total 239 349

23
P4P – 41 indicators How to pay? 3 principles –Decided standard –Professional recommendations –Statistical limits For example 25 % full payment, 25 % no payment

24
Diabetes registry. Proportion reaching target for LDL-kolesterol (<2,5 mmol/l) Targets for payment? Statistical limits 0 10 20 30 40 50 60 70 80 90 100 percent Each dot = a primary care center

25
Example of difficulties, P4P –Professional scepticism –Patient groups to small for reliable comparisons –Data sources have to be created –Leads to focus on money, not on results, wrong focus –Resource consuming technical solutions

26
Lessons learned –P4P just one small part of quality improvement programme –Focus on pay for registration, –< 4% of total payment –Involve profession! –Easy access to results –Must be combined with continuous analysis and discussion, reports, seminars etc. Professional dialogue. –Transaction cost –National cooperation National primary care register Cooperation between local quality registers

Similar presentations


 It is a recognized health fund within the framework.>")


 AND IMPORTANTLY Quality.>")
>")


