Download presentation
Presentation is loading. Please wait.

1
Data Collection & Presentation Activity

2
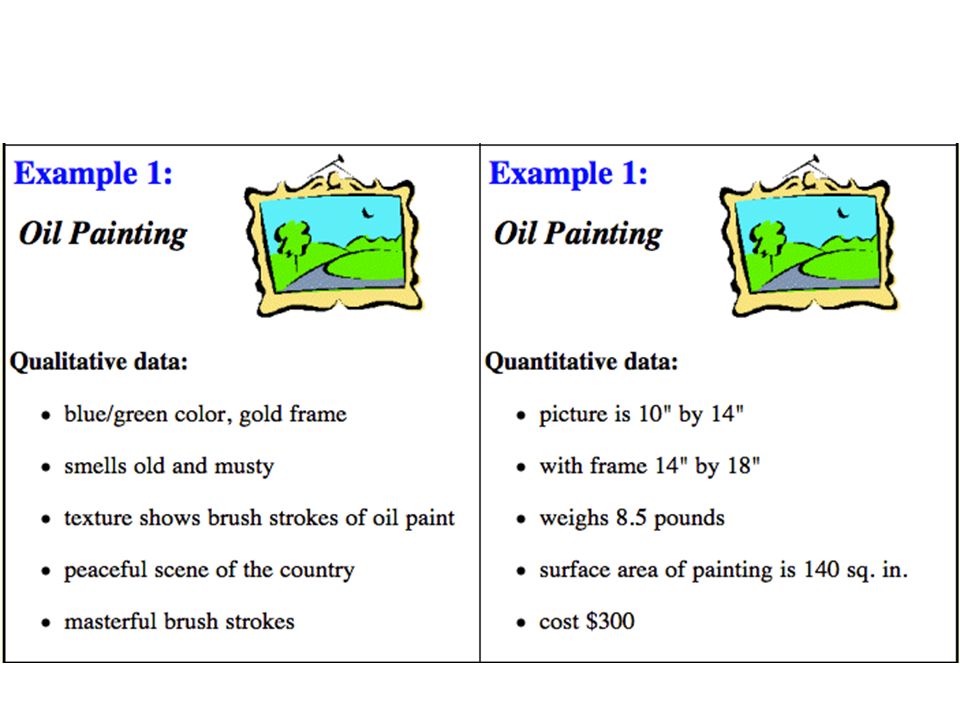
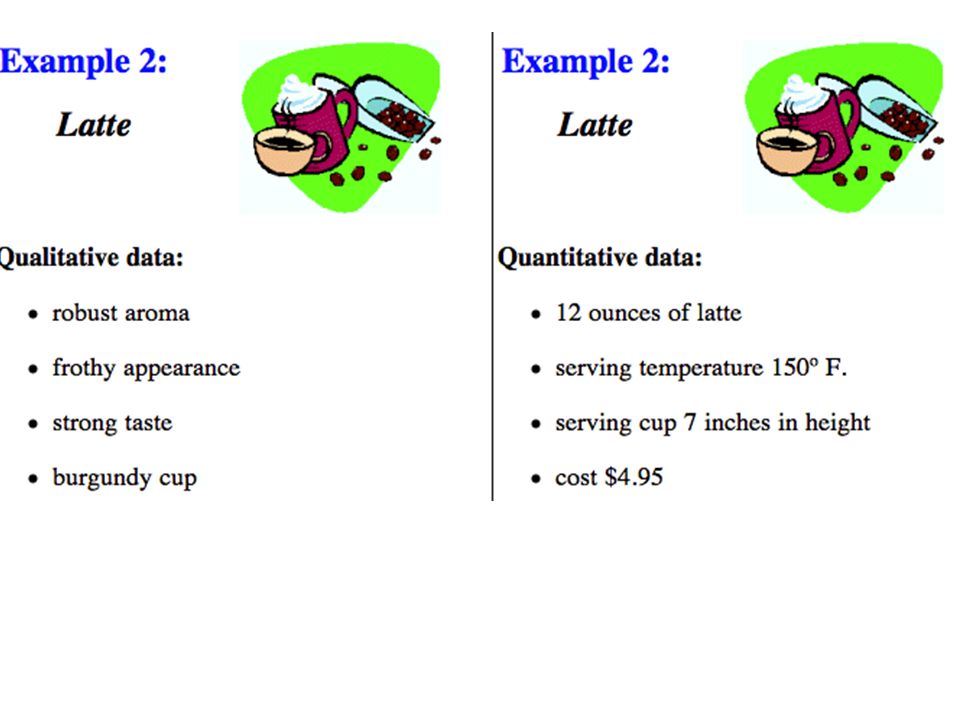
Two Types of Data There are two types of data. 1.Quantitative Data 2.Qualitative Data

3
Qualitative vs. Quantitative Qualitative Deals with descriptions. Data can be observed but not measured. Colors, textures, smells, tastes, appearance, beauty, etc. Qualitative → Quality Quantitative Deals with numbers. Data which can be measured. Length, height, area, volume, weight, speed, time, temperature, humidity, sound levels, cost, members, ages, etc. Quantitative → Quantity

7
Science uses Quantitative Data Science uses quantitative data to answer investigative questions, because it is more accurate and precise.

8
Today’s Data Collecting, Processing & Presentation Activity Working with a partner you are going to collect at least two sets of data on the class. 1.Your data set of data can contain one piece of qualitative data and quantitative dat. 2.Your data can contain two pieces of quantitative data.

9
Quantitative data In your quantitative data you are going to make a quantitative comparison between two features of the class. Examples: – Arm Length vs. Leg length – Heart rate vs. height – Weight vs. height – Length length vs. run speed – Arm Length vs. number of push-ups.

10
Qualitative & Quantitative data Examples: How many people in the class like and don’t like.

11
Step one Discuss with your partner what data you want to collect (you must get your teachers approval) Every group must do something different
 Every group must do something different")
12
Step two On a sheet or sheets of paper come up with an organized way to record your data sets. Scientists usually make a data table.

13
Example Table Oxygen Gas Production (ppm) Uncertainty +/- 5% Low Light Intensity Medium LightHigh Light Trial 12000.004000.006000.00 Trial 22225.004232.156234.77 Trial 31599.223876.115987.22 Average2000.004000.005000.00 Standard Deviation 10.5530.3315.00
 Uncertainty +/- 5% Low Light Intensity Medium LightHigh Light Trial Trial Trial Average Standard Deviation")
14
Example Table 2: The difference between boys and girl performance on a Math exam. Boys Scores (%)Girls Scores (%) 6098 6242 6888 7092 6338 6556 6595 5892 6450 6389 Average63,874 Standard Deviation 3,524,3
Girls Scores (%) Average63,874 Standard Deviation 3,524,3.")
15
Data table Example 3

16
The number of hookworms and the amount of blood

17
Step three In an organized way enter your data set in MS Excel In excel you will be making a data table for each data set. All data tables should have the following: – Titles – headings describing the numbers – Calculate averages/ means & standard deviation if appropriate

18
Step four Make a graph in excel that displays your data. All graphs should have the following – A descriptive title – X-axis labeled and units if appropriate – Y-axis labeled and units if appropriate – An appropriate scale – Error bars (if appropriate)
.")
19
Error bars represent the standard deviation of the data sets

20
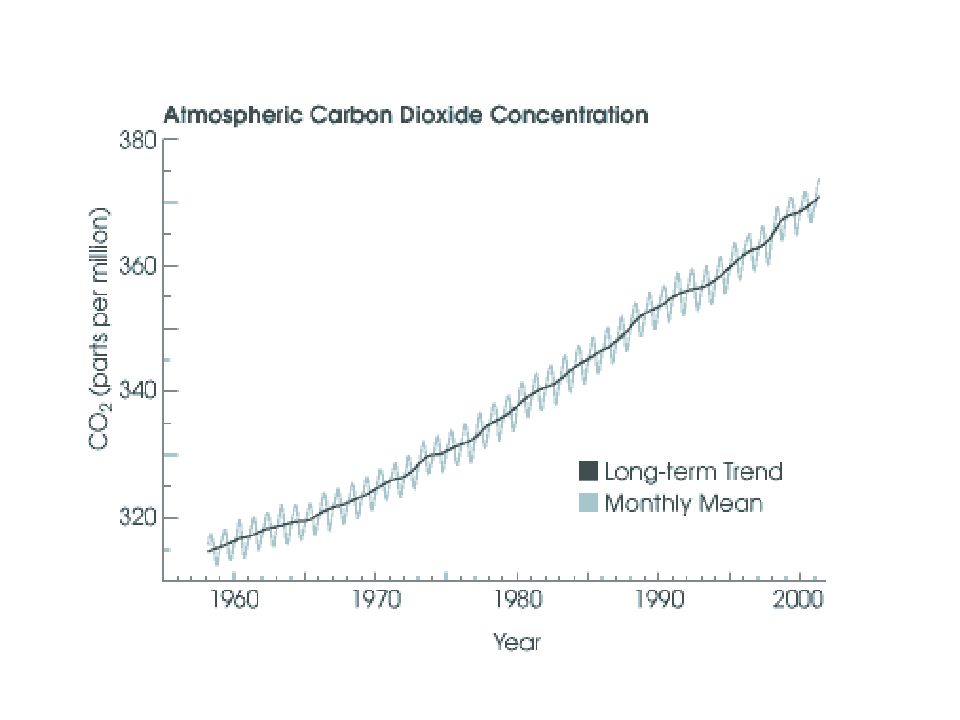
Data Chart 1: CO 2 Concentration over Time for the First Trials

23
Step Five Create a 3 slide PowerPoint presentation describing your data. Your Presentation should contain – A description of your data (describe if it is quantitative of qualitative) – A data tables – A graphs displaying data tables. – Conclusion --
 – A data tables – A graphs displaying data tables. – Conclusion --.")
Similar presentations


 or measurement.>")


 Begin by asking questions about your topic: Why? How.>")


 >")


Read the introduction 2)Fill in the Scientific Process Skills using.>")

