Download presentation
Presentation is loading. Please wait.

1
The Role of Advertising in the Growth of the Supplemental Nutrition Assistance (SNAP) Caseload The views and opinions expressed here do not necessarily reflect the views of the Economic Research Service, USDA.
 Caseload The views and opinions expressed here do not necessarily reflect the views of the Economic Research Service, USDA.")
2
Questions and Background Data Ad Placement Methodology Results Future Extensions

3
Is an advertising campaign an effective tool to increase SNAP participation? Existing evidence on Food Stamps – small scale experiments Small to Moderate Effects in other means-tested programs Examine the effect of a multi-year advertising campaign

4
Overall Radio advertisement is associated with 2 to 3% increase in caseloads. Applications also increase Approved applications do not Spanish language TV and Radio ads are sometimes negatively correlated with caseloads and applications

5
Figure 1: National Monthly SNAP Caseload & Unemployment Rate, 1979-2011

6
Explanations for Take-Up Rates < 100% * Stigma & Transaction Costs * Information

7
Enormous Change in Food Stamp Program 1996 Welfare Reform 2002 Farm Bill 2008 Name Change Variation in Eligibility Across States

8
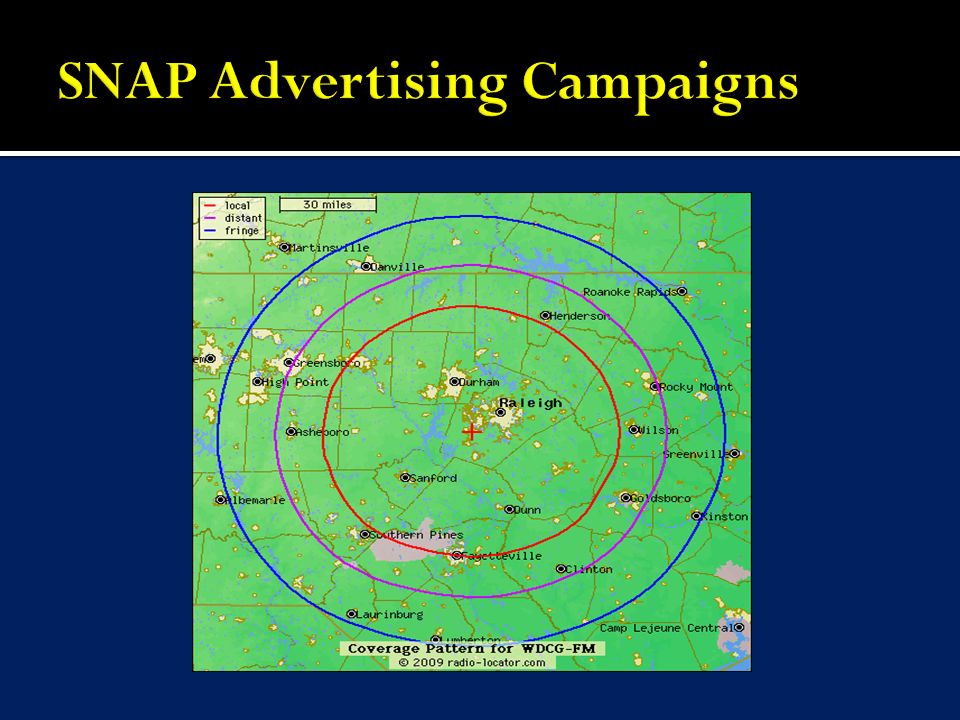
USDA-funded campaign started in 2004 to increase awareness of SNAP Emphasize the potential eligibility of working households Focus on the ability to purchase healthy food Introduce the new program name that occurred in 2008

9
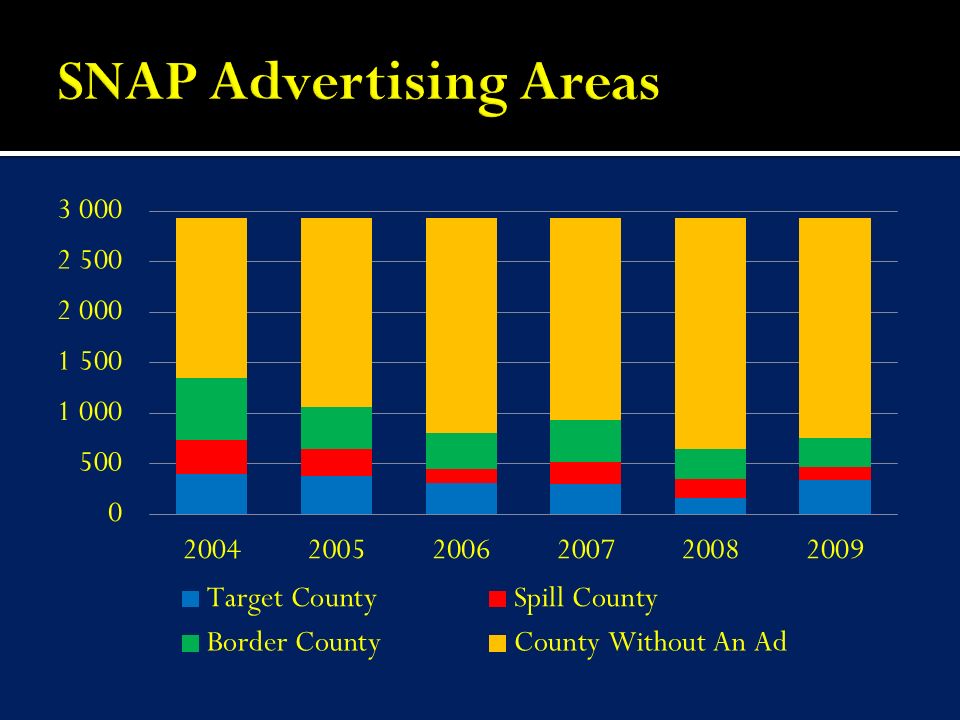
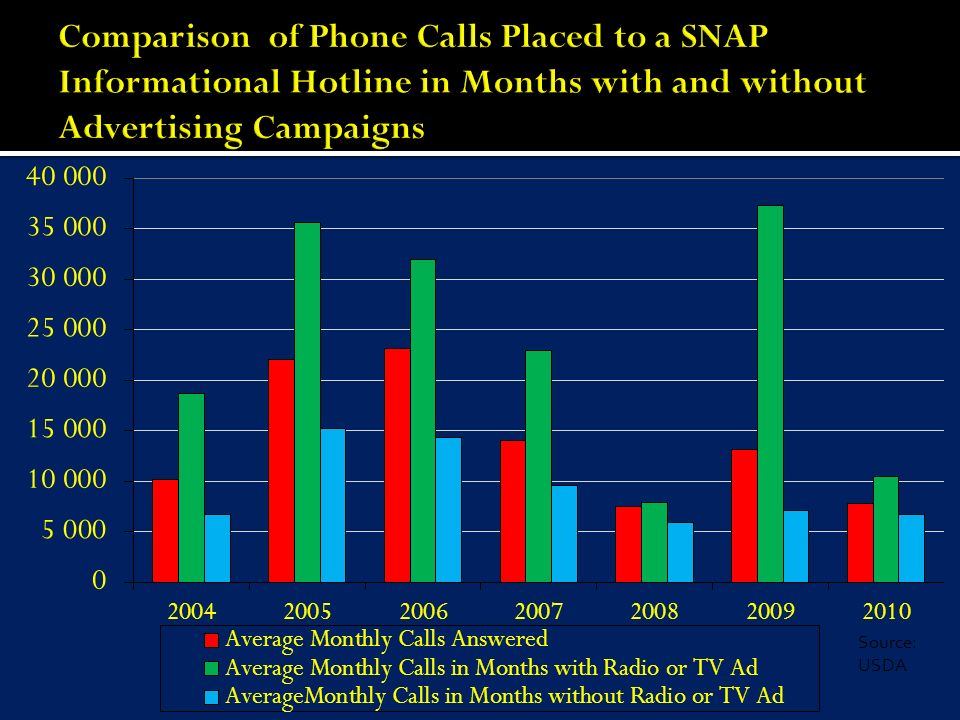
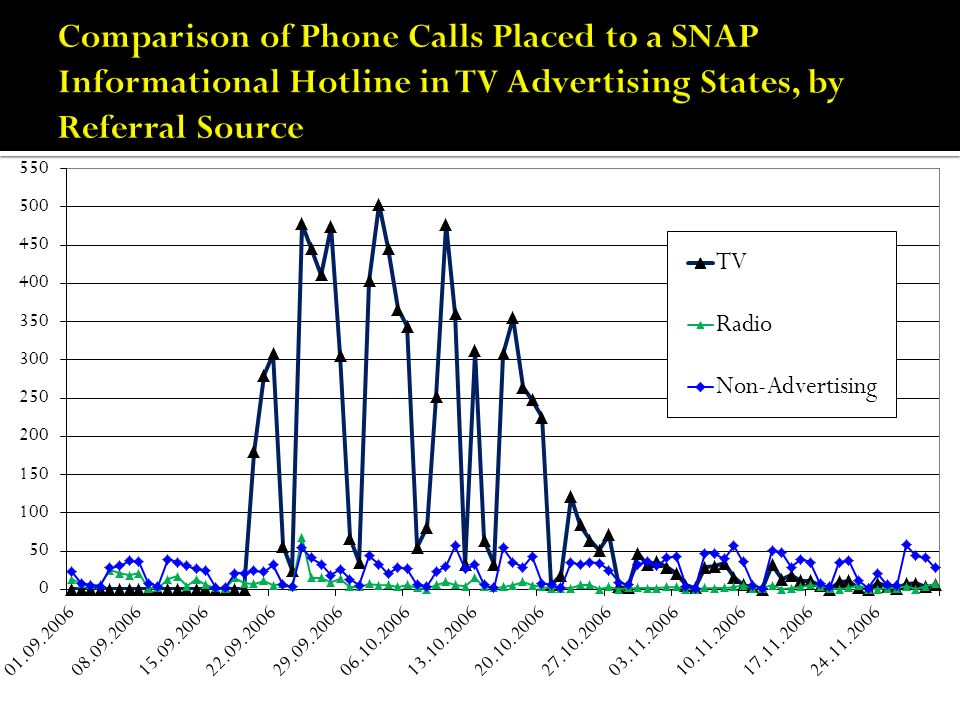
Year:2004200520062007200820092010 Number of Radio Ads 13,75010,89216,88822,12423,03220,46726,838 Months Ads Aired March April July August April May August September April May July August March April August September January February May June September October March April May June Spanish-language TV ads aired in September and October 2006

17
Caseload Monthly, county-level (total individuals/population) ▪ Unbalanced panel of monthly-level data from ~2,600 counties in 46 states ▪ Data from 2000 to 2010 Applications, Approvals, Denials Currently monthly, county-level for 14 states ▪ Data from 2000 to 2010
 ▪ Unbalanced panel of monthly-level data from ~2,600 counties in 46 states ▪ Data from 2000 to 2010 Applications, Approvals, Denials Currently monthly, county-level for 14 states ▪ Data from 2000 to 2010")
18
All States except Connecticut, Illinois, Mississippi, New Hampshire, Rhode Island Monthly Data from 2000 - 2010

19
Data Legend Applications, Approvals, & Denials Applications & Approvals Only Applications Only No Data

20
CaseloadApplicationsApprovalsDenials Year Without Ad With Ad Without Ad With Ad Without Ad With Ad Without Ad With Ad 20044.38***8.526.90**15.755.20***14.946.23*14.61 20054.56***6.04-17.00***2.59-15.60***4.631.18*14.42 2006-0.004***2.56-9.61*15.64-8.01-9.105.296.24 20073.70***5.085.707.7511.497.8116.7618.84 20086.657.273.893.7732.2330.4141.1534.95 20099.348.99-4.85***3.67-1.18***11.75-15.76***-0.57

21
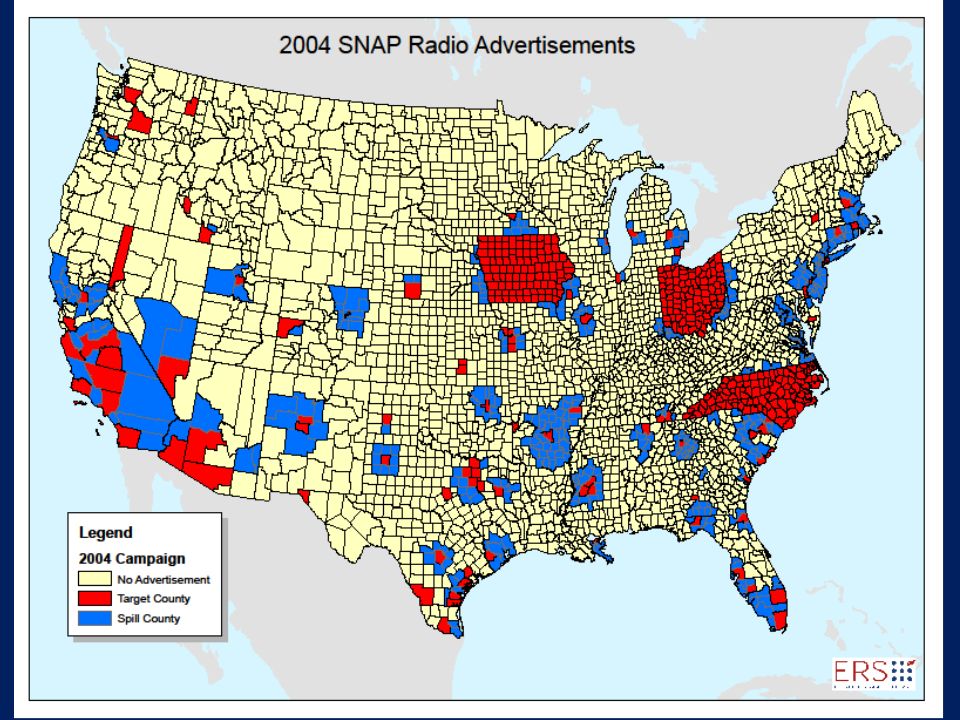
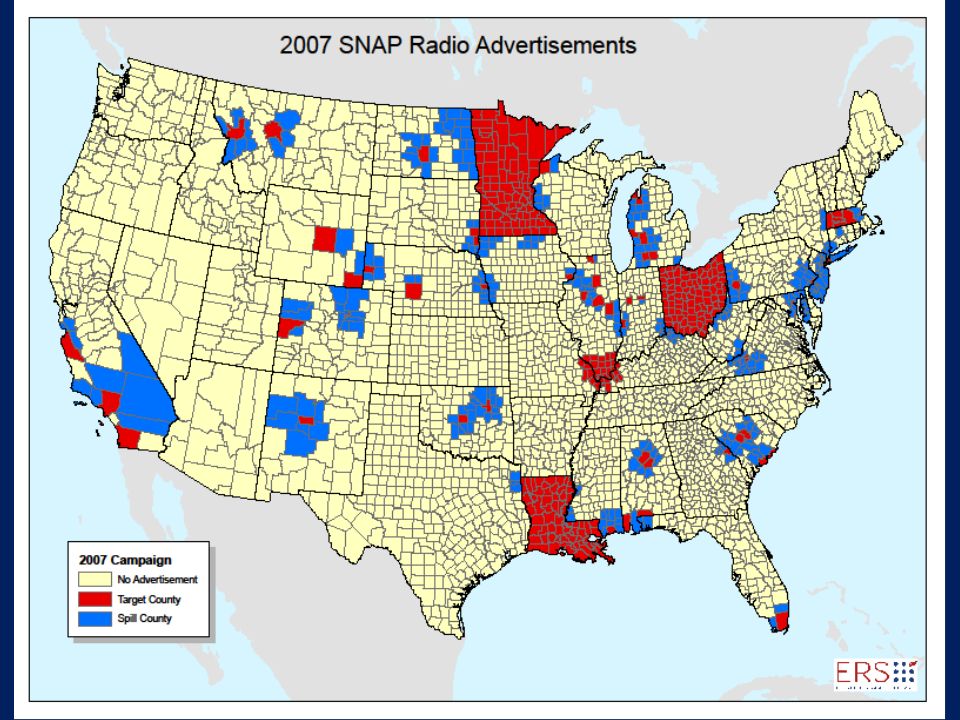
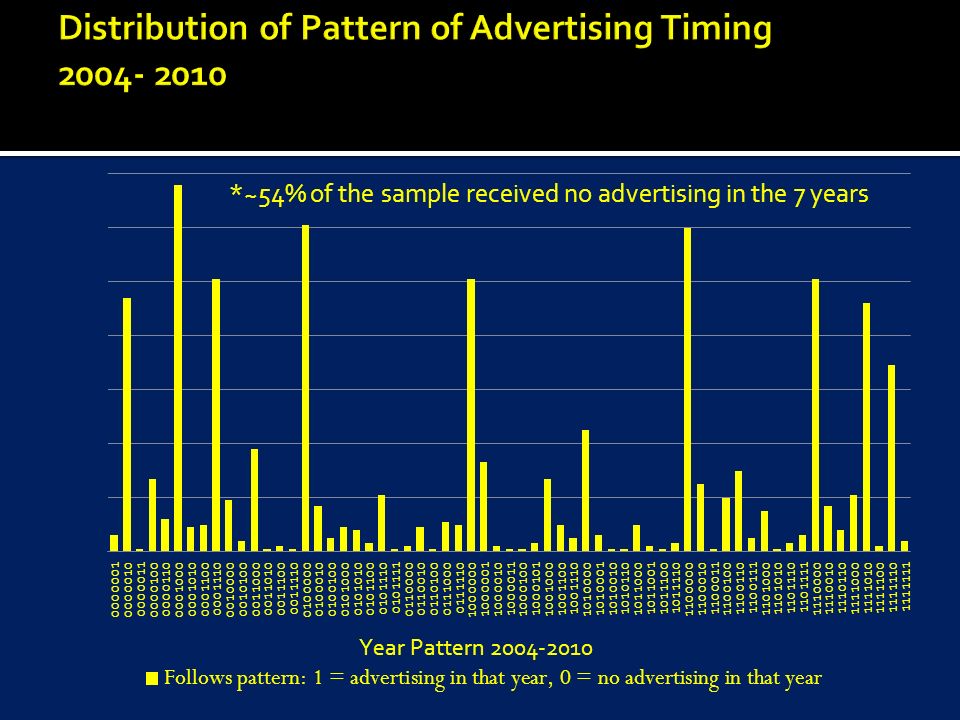
Advertising location decisions made in the fall Typically, 4-6 months prior to airing of advertisements Limited funding Many fewer counties chosen than recommended If chosen, location received advertisements for all months of the campaign in that year

22
TARGET COUNTIES County proposed to receive advertisements by a Regional Administrator (+ and large) State food security rates (+) State Very Low Food Security Rates (-) State SNAP participation Rates (-) State adoption of the SNAP name (+) SPILL COUNTIES Democratic state government (+) Counties with larger urban populations Counties with higher shares of Hispanic persons + small Still + and large when dependent variable is year of first ad.
 State food security rates (+) State Very Low Food Security Rates (-) State SNAP participation Rates (-) State adoption of the SNAP name (+) SPILL COUNTIES Democratic state government (+) Counties with larger urban populations Counties with higher shares of Hispanic persons + small Still + and large when dependent variable is year of first ad.")
26
Food Stamp Policies Demographic Characteristics Over Age 60 Female Headed Households Black, Hispanic Below Poverty Line Urban Call Centers E-Applications E-Signatures Broad-based Categorical Eligibility Immigrant Ineligibility Rules Name Change to SNAP

27
Main Specification Counties Ever Proposed for an Advertisement Counties Never Proposed for an Advertisement (1)(4) (5) Long Term Effects: 6 months of Radio Ads0.0327 ***0.0171***0.0550*** 6 months of TV Ads0.0066***-0.0225***0.0966*** 12 months of county unemployment0.0392***0.0389***0.0401*** Month Fixed EffectsYES Year Fixed EffectsYES State Time TrendsYES Observations246,574 34,325 212,249 R-squared Within0.8534 0.8643 0.8689 Number of Counties2,637 359 2,278
(4) (5) Long Term Effects: 6 months of Radio Ads ***0.0171***0.0550*** 6 months of TV Ads0.0066*** ***0.0966*** 12 months of county unemployment0.0392***0.0389***0.0401*** Month Fixed EffectsYES Year Fixed EffectsYES State Time TrendsYES Observations246,574 34, ,249 R-squared Within Number of Counties2, ,278")
28
Independent Variables Coefficient Estimates 6 months of radio ads: Target Counties0.0319*** Spill Counties0.0191*** No Ad Counties-0.0044*** Border Counties (omitted) 6 months of television ads:-0.0258*** 12 Months of unemployment0.0307*** Month Fixed Effects Yes Year Fixed Effects Yes State Time TrendsYes Observations256,474 R-squared within0.7524 Number of Counties2637
 6 months of television ads: *** 12 Months of unemployment0.0307*** Month Fixed Effects Yes Year Fixed Effects Yes State Time TrendsYes Observations256,474 R-squared within Number of Counties2637")
29
Caseloads Full Sample Caseloads ONLY states with Application data Applications Approvals (1)(2) (3) (4) 6 Months of Radio Ads 0.0327 ***0.0097*** 0.01869*** -0.0229*** 6 Months of TV Ads 0.0066***-0.0662*** 0.0346*** -0.0229*** 12 Months Unemployment 0.0392***0.0308*** 0.0417*** 0.05922*** Observations 246,57472,450 51,510 50,393 R-squared Within 0.85340.8484 0.6073 0.5859 Counties 2,637799 863 795
(2) (3) (4) 6 Months of Radio Ads ***0.0097*** *** *** 6 Months of TV Ads *** *** *** *** 12 Months Unemployment ***0.0308*** *** *** Observations 246,57472,450 51,510 50,393 R-squared Within Counties 2,")
30
Caseloads Full Sample Caseloads ONLY states w/ App data ApplicationsApprovals (1)(2) (3) (4) 6 months of Radio Ads: Target Counties0.0319***0.00014***-0.0402***-0.05998*** Spill Counties0.0191***0.0043550.0145-0.003612 No Ad Counties-0.0044***-0.00947-0.02234***-0.02612** Border Counties (omit) 6 months of TV ads:-0.0258***0.012459**0.028437**-0.014651** 12 months unemployment 0.0307***0.023107***0.01407***0.017655*** Month & Yr Fixed Effect & State trends YES Observations25647472,45031,71350,393 R-squared within0.75240.7710.41130.3058 Number of Counties2637799863795
(2) (3) (4) 6 months of Radio Ads: Target Counties0.0319*** *** *** *** Spill Counties0.0191*** No Ad Counties *** *** ** Border Counties (omit) 6 months of TV ads: *** ** ** ** 12 months unemployment *** *** *** *** Month & Yr Fixed Effect & State trends YES Observations ,45031,71350,393 R-squared within Number of Counties")
31
Caseloads Full Sample Caseloads states w/ high shares of Hispanic Applications Approvals (1)(2) (3) (4) 6 Mo of English Radio Ads0.0338***0.0434*** 0.11809 0.0513** 6 Months of Spanish Radio Ads0.0035***0.0014*** -0.06235*** -0.0783*** 6 Mo of TV Ads0.0077***0.0363***0.00465***0.01808*** 12 Months Unemployment0.0392***0.0437***0.0563435***0.0745*** Month & Yr Fixed Effect & State trendsYES Observations246,57466,374 16,322 16,170 Number of Counties2637710 213 205
(2) (3) (4) 6 Mo of English Radio Ads0.0338***0.0434*** ** 6 Months of Spanish Radio Ads0.0035***0.0014*** *** *** 6 Mo of TV Ads0.0077***0.0363*** *** *** 12 Months Unemployment0.0392***0.0437*** ***0.0745*** Month & Yr Fixed Effect & State trendsYES Observations246,57466,374 16,322 16,170 Number of Counties")
32
Overall Radio advertisement is associated with 2 to 3% increase in caseloads. Applications also increase with exposure to radio ads Approved applications do not Why? ▪ Ads encourage recertification? ▪ Caseworker behavior changes? Spanish language TV and Radio ads are sometimes negatively correlated with caseloads and applications Why?

33
Outreach has long been an important component of policy EITC, Medicaid, Veteran’s Benefits Results, thus, far indicate its most effective for those already participating

34
Gather and include additional application data Consider the effect of repeated exposure to advertising Examine observable characteristics of the caseload: average benefit amount, age, household size, employment, etc

35
Comments, Suggestions, or Questions? fitzpatk@seattleu.edu

36
Radio Ads http://www.fns.usda.gov/snap/outreach/radi o/default.htm TV Ads http://www.fns.usda.gov/snap/outreach/psas. htm

Similar presentations


 March 14, 2013.>")


 Tamara Halle, Nicole Forry, Elizabeth Hair & Kate Perper.>")


