Download presentation
Presentation is loading. Please wait.

1
Updated Thunderstorm Probability Forecast Guidance in Support of Gridded Model Output Statistics
OUTLINE Current state of Ensemble MOS Thunderstorm probability guidance for gridded MOS Initial release of gridded MOS NWA Annual Meeting, Cleveland, OH October 16, 2006

2
Current State of Ensemble MOS
MOS equations are applied to all 15 members of the GFS ensemble and the operational run to create 16 text messages Local applications like getENS generate summary values The current gridded MOS is an example of a lagged ensemble. Temperature, dew point, max and min temperature grids are created from two runs, weighted 2:1 Future ensemble MOS requirements are vague Tool for making probabilistic forecasts, based on older equations, perform testing on lagged ensemble to play with the weights, possibly include more cycles, redevelop to match temporal resolution. Image from Penn state site Image from PSU web site

3
Enhanced-Resolution MOS Support for the operational forecasters
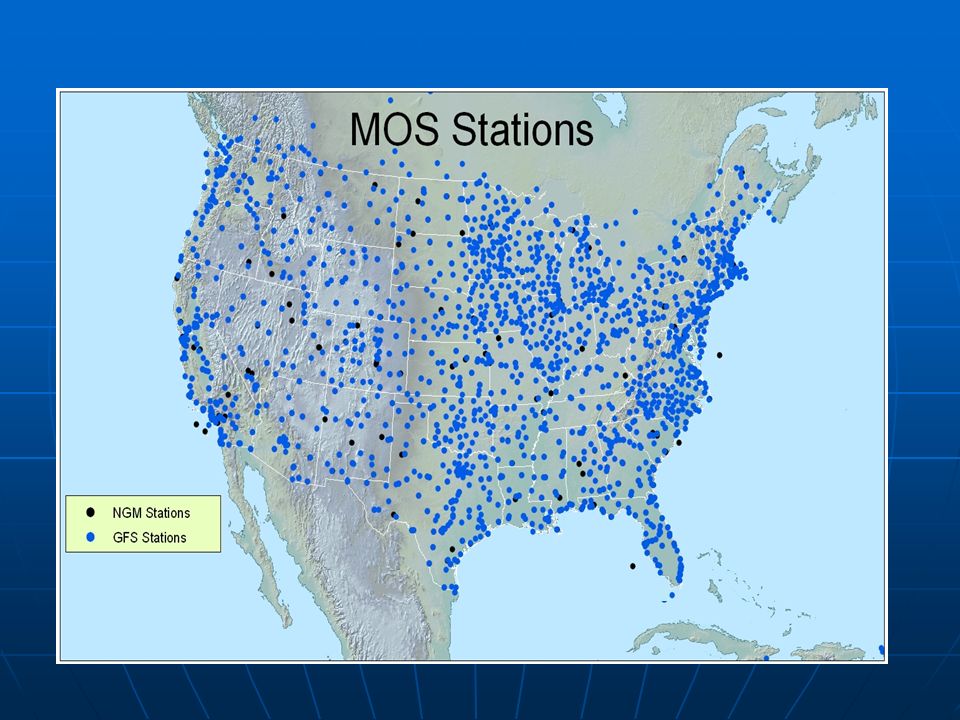
Two Approaches “True” Gridded MOS Observations and forecasts valid on fine grid Uses remotely-sensed predictand data cloud-to-ground lightning data “MOS at any point” Emphasis on high-density surface networks Uses high-resolution geophysical data Another example of remotely sensed data would be the Pop/QPF demonstration system, using 4-km hydrologic grid (HRAP); WSR-88-D, Image high temperature valid Monday, from the National Digital Forecast Database
; WSR-88-D, Image high temperature valid Monday, from the National Digital Forecast Database.")
4
Remotely-Sensed Lightning Data
NLDN cloud-to-ground lightning observations define a thunderstorm event Observations are the predictand Monthly lightning climatologies were developed from ten years of data for 3-, 6-, 12-, and 24-h time periods, to be used as predictors Observed lightning data are used to verify the thunderstorm guidance Predictand, the event we want to forecast

5
Creating the Gridded Lightning Datasets from Observations Strikes are summed over the appropriate time period and assigned to the center of the grid boxes ×××× × ××× ×× 3-, 6-, 12-, and 24-h time periods, any grid resolution. Used 40-km in this development. = thunderstorm = no thunderstorm

6
Probabilities for Different Grid Resolutions
Probabilities for 40-km vs 20-km grid resolutions, both 3-h time periods. Pattern is similar, but the magnitude of the probabilities are reduced almost in half, when the resolution is doubled. Documented in AMS preprint Seattle 2004. 40-km 21-24h period 10% contour interval 20-km 21-24h period 10% contour interval

7
Probabilities for Different Time Periods
Comparison of probabilities for 12-h vs 3-h time periods both on the 40-km grid As the resolution increases in time and space, the magnitude of the probabilities will decrease as the likelihood of an event at an exact time and point in space approaches zero

8
MOS Thunderstorm Probability Guidance
Given that: The area covered by the forecast should be at least as large as the event Thunderstorm forecast probabilities traditionally represent an area within 25 miles of a point, and We don’t want the probabilities to become so small they lose information and credibility… The gridded MOS thunderstorm probability is defined as the probability of one or more cloud-to-ground lightning strikes in a 40-km square grid box during a given time period. So: The guidance is interpolated to the 5-km NDFD grid using bilinear interpolation It represents the likelihood of a cloud-to-ground lightning strike km around each 5-km grid box, and Stations have the value of the 40-km grid box they are sitting in, using nearest neighbor assignments, to fill in the text messages Bilinear interpolation interpolates in both the x- and y-direction

9
Thunderstorm Equation Development
Equations developed from 5 years of GFS model output All 40-km “stations” were combined into one region increased sample size and eliminated boundaries Separate equations were developed for 3 seasons Spring: March 16 – June 30 Summer: July 1 – October 15 Cool: October 16 – March 15 3-h time periods through day 3; 6- and 12-h time periods through day 7. Important Predictors Stability Indices Convective precipitation amount Product of vertical velocity * relative humidity K-index * thunderstorm relative frequency Thunderstorm relative frequencies approximately 6,800 stations on the 40-km grid, interpolated to 380,000 stations on the 5-km grid Stability indices like CAPE, K-index, best lifted index K-index * rf is an interactive predictor. RFs alone more important at later projections

10
Gridded MOS Thunderstorm Products
NDGD web-based graphics Distributed in GRIB2 format 3-,6-, 12-h forecast periods Available in AWIPS with OB7.1 release, as part of the gridded MOS system

11
“Enhanced-Resolution” MOS
“True” gridded MOS Uses remotely-sensed data, i.e. the probability of a thunderstorm “MOS at any point” Emphasis on high-density surface networks; Co-Op, buoy, mesonet, etc Uses high-resolution geophysical data Analyze forecasts on high-resolution grid Traditional MOS downscales the model output to specific sites Examples of weather elements temperature dew point temperature max/min temperature wind speed and direction relative humidity probability of precipitation (6- and 12-h periods)
")
14
Gridded MOS Objective Generate guidance sufficient for forecast initialization at WFOs
Generate guidance with an accuracy comparable to that of the station-oriented guidance – do no harm. Support NDFD, useful as a first guess, may give the forecasters the same starting point, helpful to eliminate WFO boundary problems Generate guidance sufficient for forecast initialization at the WFOs, currently on a 5-km grid, headed towards 2.5-km

15
Forecaster Feedback is Invaluable Gridded MOS wind speed problem
Strange dots Bad “if test” in a wind post-processing subroutine created calm winds, when the direction was near 0. Too many calm mountain winds A control file setting caused excessive calm winds over the mountains UTC 21 hour forecast

16
Forecaster Feedback is Invaluable Thank you
The subroutine and control files have been fixed and implemented UTC 21 hour forecast UTC 21 hour forecast

17
Summary Gridded MOS thunderstorm probabilities are valid over a 40-km area, for each 5-km NDFD grid box Gridded MOS is a work in progress more elements are coming improvements to current algorithms and equations expected increased resolution from 5-km to 2.5-km User feedback is critical to define requirements and improve the products Alaska and other OCONUS areas are in the early stages of development Link to documentation and products

Similar presentations


 Research Applications Laboratory (RAL) and Developmental Testbed.>")


 Full range of products available at:>")


 Guidance by Using Emerging Forecast and Observation Systems Judy E. Ghirardelli, Jerome P. Charba,>")

 at NCEP HPC Peter C. Manousos NCEP HPC Science & Operations Officer>")