Download presentation
Presentation is loading. Please wait.

1
Introduction #2 C Global Patterns

2
The first two slide shows in this introduction illustrated the importance of the sun’s solar energy and how it effects on temperature, pressure and wind. Now let’s put this all together and see how the earth as a whole is affected. Be patient because many concepts are coming your way, you need to see the entire slide show to understand.

3
This is a simplified image of the circulation of the atmosphere. Why would the arrows go in different directions?

4
Before we answer the question posed in the previous slide, let us look at how wind is created. Please listen carefully this can be confusing. This is the simplest diagram - It represents a non-rotating earth.

5
With a rotating earth the coriolis effect plays a role and the wind goes in a different direction - called a ‘Geostrophic wind’ in the upper atmosphere.

6
At the surface ‘friction’ is added because of land and the wind again changes direction. This is the actual direction of wind flow and it is called ‘Surface Wind’.

7
This is really what happens. Remember wind travels from a High to a Low. The earth is spinning so the Coriolis effect bends the wind. Relax - this is going to take time to explain. ITCZ- Intertropical Convergence Zone - where the trade winds meet. In this zone you also find the Doldrums: an area with no wind.

8
Yet another look. Notice the work of the Hadley Cells In all of this the earth is trying to maintain a balance. No area too cold and no area too warm!

9
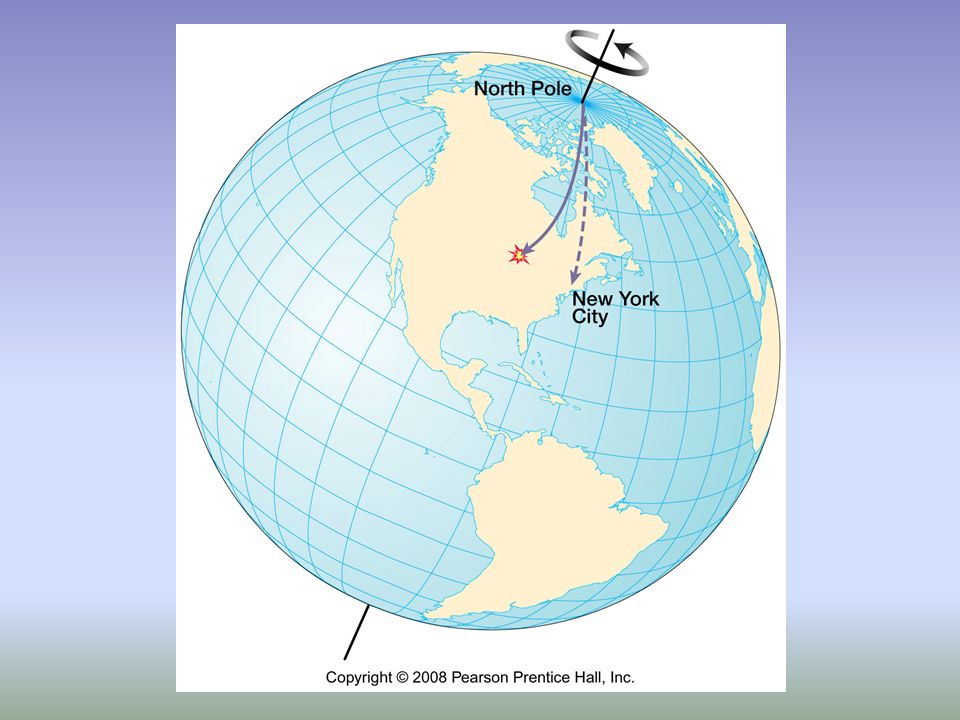
The earth spins - therefore wind does not travel straight - it curves. The dashed line is for a non- rotating earth.

11
The deflection caused by the Coriolis effect is to the right in the Northern Hemisphere and to the left in the Southern Hemisphere. The dashed lines are for a non-rotating earth while the solid lines represent the actual movement. Note: the Equator is spinning slower than the poles since the earth is larger at the equator. Speed at Equator - 1675 km per hour Speed at Poles - 838 Kmph

12
Different Temperatures and different Pressures exist everywhere due to the inconsistencies of the earth’s surface. Land and water add to these inconsistencies - can you think of any others?

13
Cities surrounded by land have a Continental climate. Cities near water have a Maritime climate. Look at the stats below the graphs. What are the Characteristics of Continental and Maritime?

14
Land-Sea Breezes

15
Monsoonal Winds H H L L Farmers really depend on the Monsoon rains!

16
Mountain Valley Breezes Warm air rises Cool air descends

17
You should remember the summer and winter effects of the Jet Stream on Toronto. It’s position created a wet summer in 2008!

18
It is the Rossby waves that create the large High Pressure or Low Pressure cells in our part of the world.

19
Why do you think Trondheim, Norway is warmer than Verkhoyansk, Russia?

20
This is a simplified image of the water circulation in the Atlantic Ocean. Again different directions? And the Continents are in the way

21
Major Ocean Currents

22
Insolation at Earth’s Surface Wind and Pressure all depends on the Sun!

23
04_23.JPG Even the time of year comes into play - of course the tilt of the earth!

24
Global Sea Temperatures in June 2006

25
Average Temperatures in Winter - the lines are called Isotherms. Compare Toronto to Rome.

26
Average Temperatures in Summer

27
An interesting Satellite image of the Gulf Stream. Red represents hot water while blue represents cold water.

28
We must finish off by looking at the effects on Temperature by Humans and Pollution.

29
This is scary! Rising Temperature melts Glaciers, increases the temperature and the levels of the oceans. What other effects could all of this have?

30
The End

Similar presentations


 Topic 6: Wind Chris Parkes Rm 455 Kelvin Building.>")

 Chapter 6.>")
