Download presentation
Presentation is loading. Please wait.

1
Climate Change and Ozone Loss G. Tyler Miller’s Living in the Environment 14 th Edition Chapter 21 G. Tyler Miller’s Living in the Environment 14 th Edition Chapter 21

2
Key Concepts Changes in Earth’s climate over time Factors affecting climate Possible effects of global warming Adapting to climate change Human impacts on the ozone layer Protecting and restoring the ozone layer

3
Average temperature over past 900,000 years Thousands of years ago Average surface temperature (°C) 900800700600500400300200100Present 9 10 11 12 13 14 15 16 17 Past Climate Changes
 Present Past Climate Changes")
4
Temperature change over past 22,000 years Years ago Temperature change (°C) 20,00010,0002,0001,000200100Now -5 -4 -3 -2 0 1 2 End of last ice age Agriculture established Average temperature over past 10,000 years = 15°C (59°F) Past Climate Changes
 20,00010,0002,0001, Now End of last ice age Agriculture established Average temperature over past 10,000 years = 15°C (59°F) Past Climate Changes")
5
Temperature change over past 1,000 years Year Temperature change (°C) 100011001200130014001500160017001800190020002101 -0.5 0.0 0.5 1.0
")
6
Average temperature over past 130 years Year Average surface temperature (°C) 186018801900192019401960198020002020 13.6 13.8 14.0 14.2 14.4 14.6 14.8 15.0 Recent trends in global temperatures
 Recent trends in global temperatures")
7
IPCC 1988 UN and the World Meteorological Organization established the (IPCC) Intergovernmental Panel on Climate Change to document past climate change and project future climate change. A network of over 2,000 leading climate experts from 70 nations.

8
Table 21-1 Page 464 Table 21-1 Major Greenhouse Gases from Human Activities Greenhouse Gas Carbon dioxide (CO2) Methane (CH4) Nitrous oxide (N2O) Chlorofluorocarbons (CFCs)* Hydrochloro- fluorocarbons (HCFCs) Hydrofluorocarbons (HFCs) Halons Carbon tetrachloride Average Time in the Troposphere 100–120 years 12–18 years 114–120 years 11–20 years (65–110 years in stratosphere) 9–390 15–390 65 42 Human Sources Fossil fuel burning, especially coal (70– 75%), deforestation, and plant burning Rice paddies, guts of cattle and termites, landfills, coal production, coal seams, and natural gas leaks from oil and gas production and pipelines Fossil fuel burning, fertilizers, livestock wastes, and nylon production Air conditioners, refrigerators, plastic foams Fire extinguishers Cleaning solvent Relative Warming Potential (compared to CO 2 ) 1 23 296 900–8,300 470–2,000 130–12,700 5,500 1,400
 Methane (CH4) Nitrous oxide (N2O) Chlorofluorocarbons (CFCs)* Hydrochloro- fluorocarbons (HCFCs) Hydrofluorocarbons (HFCs) Halons Carbon tetrachloride Average Time in the Troposphere 100–120 years 12–18 years 114–120 years 11–20 years (65–110 years in stratosphere) 9–390 15– Human Sources Fossil fuel burning, especially coal (70– 75%), deforestation, and plant burning Rice paddies, guts of cattle and termites, landfills, coal production, coal seams, and natural gas leaks from oil and gas production and pipelines Fossil fuel burning, fertilizers, livestock wastes, and nylon production Air conditioners, refrigerators, plastic foams Fire extinguishers Cleaning solvent Relative Warming Potential (compared to CO 2 ) –8, –2, –12,700 5,500 1,400")
9
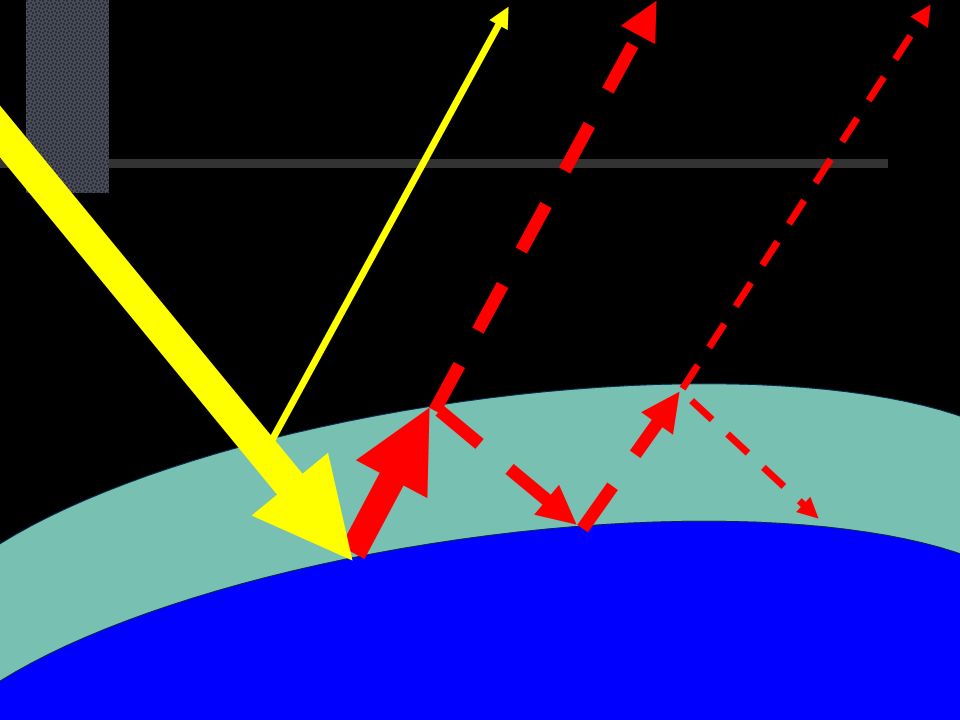
The Greenhouse Effect Fig. 6-14 p. 110

10
Climate Change and Human Activities Increased use of fossil fuels Deforestation Global warming Melting icecaps and glaciers Rising sea level

11
Global Warming Svante Arrhenius first speculated in 19 th century Current Causes Deforestation Greenhouse Gas Levels Burning of Fossil Fuels Main villain is currently Carbon Dioxide (CO 2 )
")
12
Deforestation

13
Deforestation - US About one half of the forests that covered the Earth are gone Since 1600, 90% of the U.S. forests have been cleared away

14
Deforestation - Rainforests One football field of rainforest is lost every 1.4 seconds

15
Results of Deforestation Loss of trees’ ability to remove CO 2 Decaying trees release CO 2 and methane 25% of global GHG emissions Fallen trees are often burnt which releases CO 2 Accounts for 20% of global CO 2 emissions Deforestation the largest source of emissions in developing countries

16
Greenhouse Effect

17
Certain gases in the Earth’s atmosphere trap energy from the sun carbon dioxide – water vapor methane – nitrous oxide Without these gases, the Earth’s average temperature would be about 60ºF colder Greenhouse Gases These gases are Greenhouse Gases

22
Global Warming

23
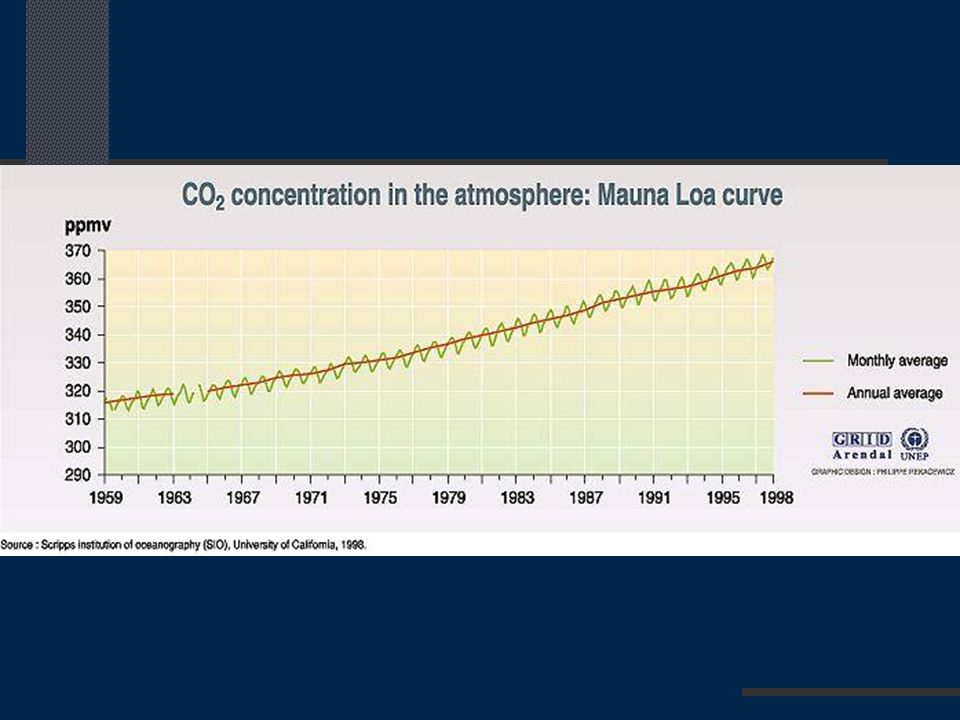
Evidence CO 2 and Temperature

27
Five Warmest Years on Record 1. 2005 2. 1998 3. 2002 4. 2003 5. 2006 Since 1980, the Earth has experienced 19 of its 20 hottest years on record

28
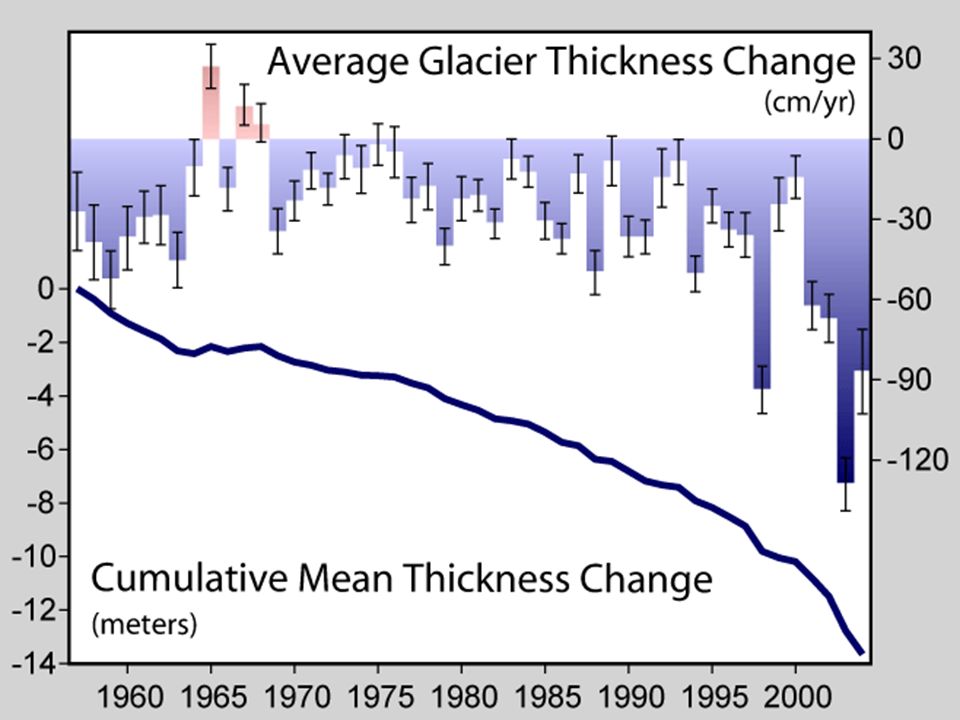
Evidence CO 2 and TemperatureGlaciers

30
Portage Glacier- near Anchorage Alaska- 1950/2001

32
Rhone glacier in the Kanton of Valais, Switzerland 1859 / 2001

33
Grinnell glacier, Glacier National Park, USA 1911 / 2000

34
Glacier Ururashraju, at about 15,000 feet in Cordillera Blanca of Peru 1986 / 1999

35
2004

38
Glaciers Have been shrinking throughout the 20th Century Loss of glaciers in South America and Asia glaciers is particularly rapid and will threaten the water supplies of millions of people

39
Evidence CO 2 and Temperature Glaciers Polar Ice Arctic Antarctic Greenland

40
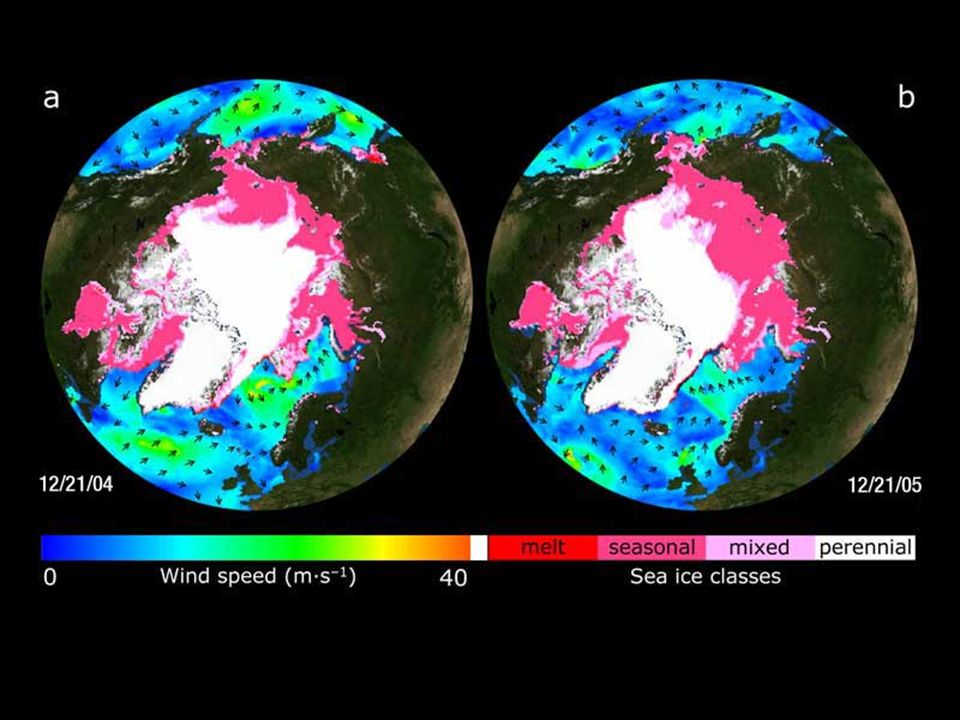
Arctic Ice

41
Perennial ice may be 10 or more feet thick New ice is only one to seven feet thick Since 1970 10% loss of ice cover per decade

42
Albedo Effect

46
Albedo, or reflectivity Fig. 21-17 p. 480

48
NASA Sees Rapid Changes in Arctic Sea Ice NEWS RELEASE: September 13, 2006 From 1970 until 2000 there was a 10 percent decrease in Arctic perennial sea ice every decade 14 percent Between 2004 and 2005 the ice shrunk abruptly by 14 percent

50
Permafrost

51
Permafrost Where soil over 1-meter down never thaws About 10% of Earth’s surface has permafrost Tundra and taiga are characterized by extreme cold 24 hours of sun during the summer Huge amount of vegetation grows In the last 11,000 years, the permafrost has not thawed None of the vegetation has decayed Decay releases CO 2 and methane

53
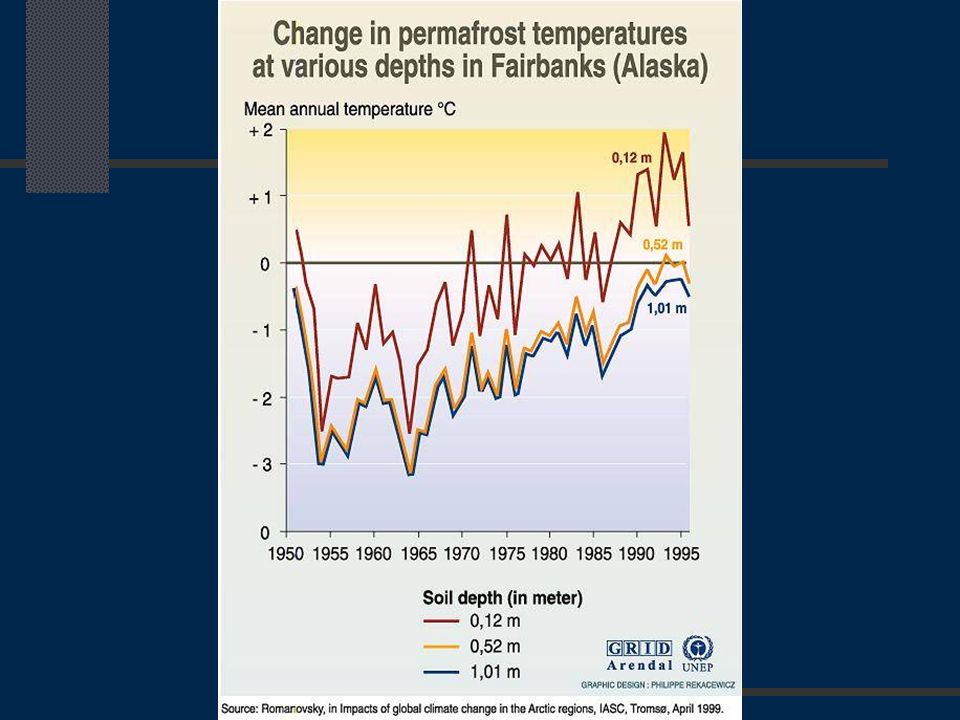
Permafrost Alaska permafrost temperature has increased 0.5° to 1.5° C since 1980, Serious effects include forest damage sinking roads and buildings eroding tundra riverbanks changes in tundra vegetation increased carbon dioxide and methane emissions from thawed peat.

54
Permafrost Estimates of billions of tons of methane Double existing methane in atmosphere Methane is 20 to 60 times as strong of a greenhouse gas as CO 2 10 to 25% increase in global warming

55
Antarctic Ice

56
Antartica Land mass covered by multiple glaciers Glaciers average 8000 feet thick Represents 10% of all landmass on Earth

57
Moulins Rivers of water about 10 meters in diameter that flow through the glacier Bring melted water below the glaciers

59
Series of Moulins

60
Antarctica Melting If all of the ice in the glaciers of Antarctica melt the oceans will rise 200 feet

62
Greenland Ice

64
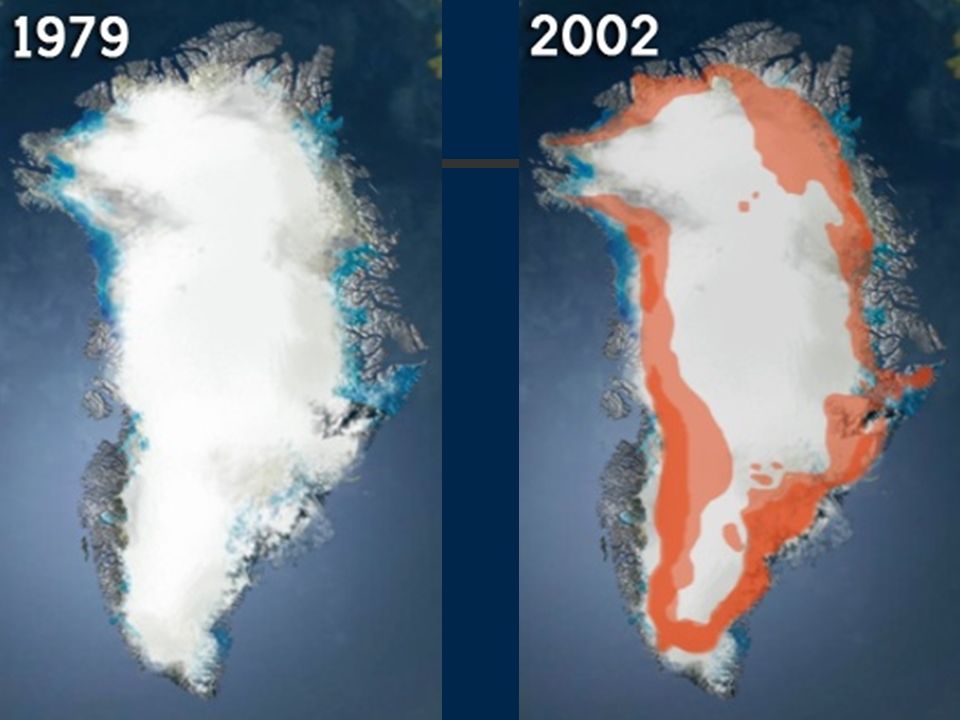
Greenland Ice Melt Glaciers located on three islands Greenland loses 20% more ice than it gains each year If all of the ice melts – oceans will rise 23 feet If moulins work like those in Antarctica…

65
Evidence CO 2 and Temperature Glaciers Polar Ice Arctic Antarctic Greenland Weather Severity

66
Droughts The 1999-2002 national drought was one of the three most extensive droughts in the last 40 years In 2002, the Western United States experienced its second worst wildfire season in the last 50 years; more than 7 million acres burned The period from April through June of 1998 was the driest three-month period in 104 years in Florida, Texas, and Louisiana

70
Evidence CO 2 and Temperature Glaciers Polar Ice Arctic Antarctic Greenland Weather Severity Biome Changes

73
Oceans absorb CO 2 CO 2 in water makes Carbonic Acid Increased CO 2 especially in cold water As cold deep ocean currents (abyssal) resurface they are release CO 2 Greater acidity of oceans is one of the factors that effect bleaching coral
 resurface they are release CO 2 Greater acidity of oceans is one of the factors that effect bleaching coral")
Similar presentations


 McGraw Hill Ryerson 2007 11.2 Human Activity and Climate Change Climate change is the change in long-term weather patterns in certain regions. These.>")


 McGraw Hill Ryerson 2007 11.2 Human Activity and Climate Change Climate change is the change in long-term weather patterns in certain regions. These.>")
 McGraw Hill Ryerson 2007 11.2 Human Activity and Climate Change Climate change is the change in long-term weather patterns in certain regions. These.>")

