Download presentation
Presentation is loading. Please wait.

3
Selling Quantity Price Demanded $ 3 $ 2 $ 1 $ 4 10 25 40 60 15 $ 5

4
Price Quantity $6 $5 $4 $3 $2 $1 10203040 50 60 0 Demand Downsloping left -Plot the points Graphing: -Connect the dots to right Demand

5
Shifts in Demand versus Movements Along a Demand Curve Quantity demanded – is a specific amount that will be demanded per unit of time at a specific price, other things constant A change in price changes quantity demanded A change in price causes a movement along the demand curve Demand refers to a schedule of quantities of a good that will be bought per unit of time at various prices, other things constant

6
Shifts in Demand versus Movements Along a Demand Curve A change in anything other than price that affects the demand curve shifts the entire demand curve Movement of the entire demand curve is a shift in demand

7
Selling Quantity Price Old New 0 $ 3 $ 2 $ 0 $ 1 $ 4 1 $ 6 3 4 6 5 2 $ 5 1 3 4 6 5 2 7 0 1 3 4 5 2 DecInc Caused by a Change in a Determinant Movement OF the curve

8
Price Quantity $6 $5 $4 $3 $2 $1 1234 5 6 0 Old Increase in Demand shifts out or to the right Decrease in Demand shifts in or to the left

9
1 Why the curve shifts 2 3 4 5 Consumer Tastes Price of Other Goods Society’s Income Number of Consumers Consumer Expectations Taxes and Subsidies 6

10
1Consumer Incomes +tax cuts increase net incomes Consumers have more money to spend, demand increases -the $ depreciates against the Euro Imported goods from Europe cost more dollars, demand decreases For Normal Goods!!!

11
-the $ depreciates against the Euro Domestic travel looks better, demand increases For Inferior Goods Consumers switch to better goods, demand for Hot Dogs decreases +tax cuts increase net incomes

12
2 Price of Other Goods If airlines cut ticket prices More demand for Luggage Less demand for train tickets

13
Tickets and Luggage are compliments Airlines and Trains are Substitutes If ticket prices decrease, demand for Luggage increases If ticket prices increase, demand for Luggage decreases If air tickets increase, demand for Train tickets also increases Compliments are consumed or used together (inverse relationship) Substitutes replace each other (direct relationship) If air tickets decrease, demand for Train tickets also decreases
 Substitutes replace each other (direct relationship) If air tickets decrease, demand for Train tickets also decreases")
14
3 Consumer Tastes - beanie hats make a comeback Demand increases -Hula Hoops go out of style Demand decreases Or why the curve shifts

15
4Consumer Expectations - dealers reduce car prices in August Car buyers wait, demand decreases - heavy rains have damaged coffee crop Consumers expect shortages and higher prices so they buy more now, demand increases

16
+ subsidies encourage consumption Taxes and Subsidies - taxes discourage consumption 5

17
6 Number of Consumers (also Demographics) -Hurricanes around Labor Day Fewer tourists touring Florida and the Gulf Coast, demand decreases More tourists touring, NC and SC, demand increases
 -Hurricanes around Labor Day Fewer tourists touring Florida and the Gulf Coast, demand decreases More tourists touring, NC and SC, demand increases")
18
JonesSmith2-Person market 132336245768145768214578 Price Weekly frozen pizza consumption At $3.50 Jones demands 1 pizza … and so on … At $3.50 Smith demands 2 pizzas … $3.50 $2.50 $3.50 $2.50 d $3.50 $2.50 D d Consider Jones’s demand for frozen pizza. at $2.50 3 pizzas … Consider Smith’s demand for frozen pizza. at $2.50 3 pizzas … The market demand curve is merely the horizontal sum of the individual demand curves (here Jones and Smith). The market demand curve will slope downward to the right, just as the individual demand curves do. Individual and Market Demand Curves
. The market demand curve will slope downward to the right, just as the individual demand curves do. Individual and Market Demand Curves.")
20
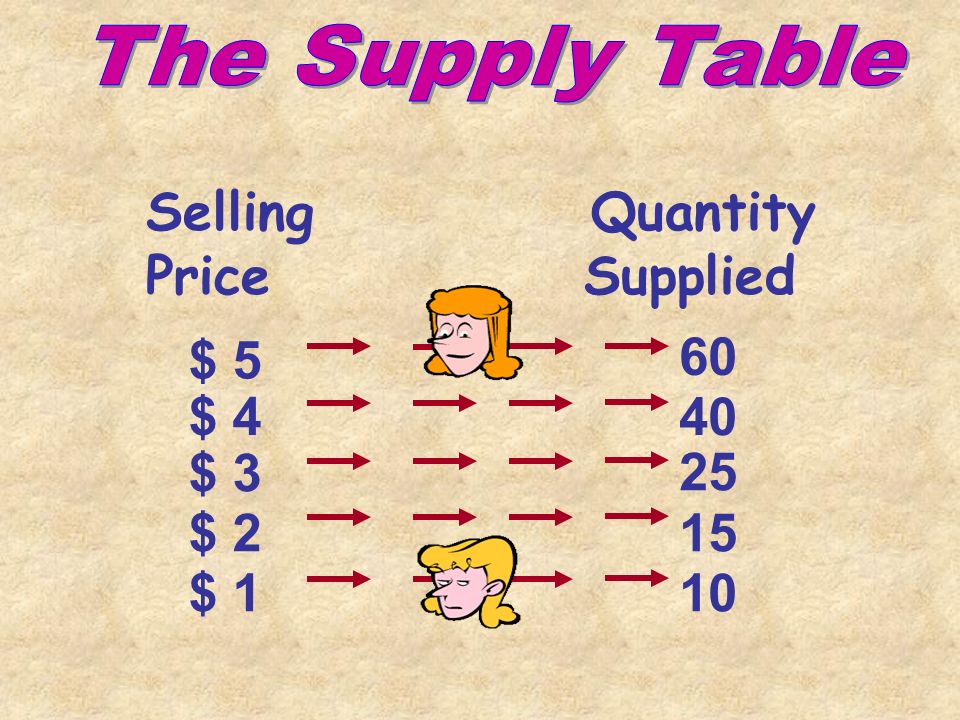
Selling Quantity Price Supplied $ 3 $ 2 $ 1 $ 4 60 25 15 10 40 $ 5

21
Price Quantity $6 $5 $4 $3 $2 $1 10203040 50 60 0 Upsloping right -Plot the points Graphing: -Connect the dots to left Supply

23
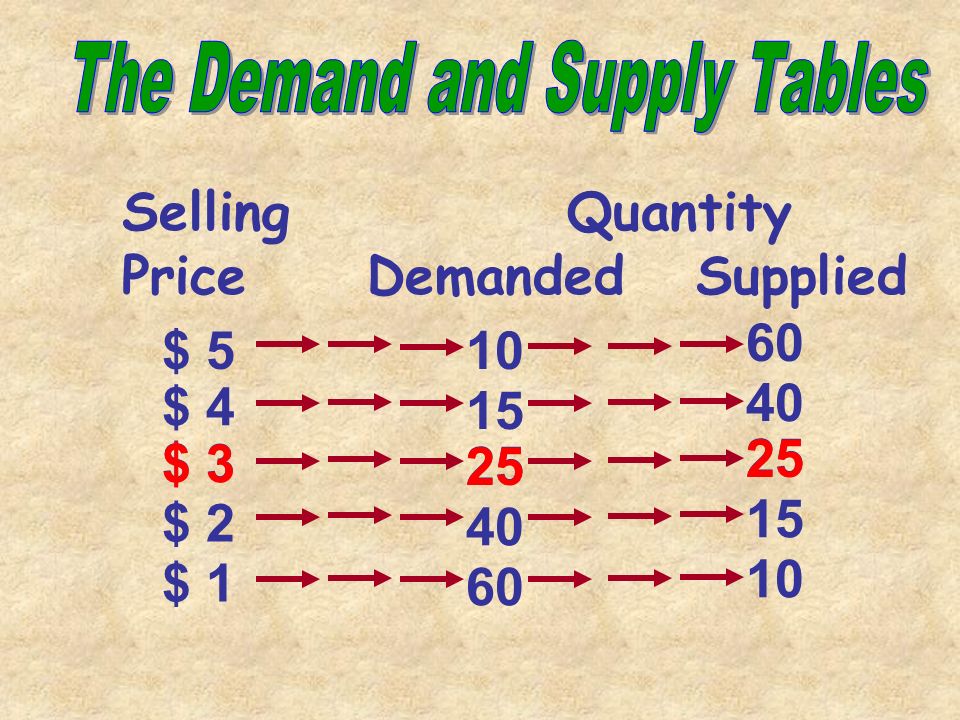
Selling Quantity Price Demanded Supplied $ 3 $ 2 $ 1 $ 4 10 25 40 60 15 $ 5 60 25 15 10 40 $ 3 25

24
Price Quantity $6 $5 $4 $3 $2 $1 10203040 50 60 0 D -Plot Demand Graphing: -Plot Supply D S S

25
1 Why the curve shifts 2 3 4 5 Consumer Tastes Price of Other Goods Consumer Incomes Number of Consumers Consumer Expectations

26
Consumers responding to a Change in the Price of the good Caused by factors related to production of the good Harder or costlier to produce, price goes up Movement ALONG the curve Quantity $6 $5 $4 $3 $2 $1 1234 5 6 0 Demand Supply Curve Current Price Price P Q decrease increase Easier or less expensive to produce, price goes down What makes the Supply Curve Shift?? P1P1 P2P2 P3P3 Q2Q2 Q1Q1 Q3Q3 The Supply Schedule!! What makes the Supply Curve Shift??

30
Selling Quantity Supplied Price Old New 6 $ 3 $ 2 $ 1 $ 4 5 $ 6 3 2 1 4 $ 5 7 5 4 2 3 6 4 3 1 0 5 2 DecInc Caused by a Change in a Determinant Movement OF the curve

31
Price Quantity $6 $5 $4 $3 $2 $1 1234 5 6 0 Old Increase in Supply shifts out or to the right Decrease in Supply shifts in or to the left

32
1 Resource Prices Why the curve shifts 2 Changes in Technology 3Prices of other goods Taxes and Subsidies 4 5Number of Producers

33
1 Resource Prices - oil is discovered under Randolph Supply increases -Minimum wage goes up Supply decreases Or why the curve shifts

34
2 Changes in Technology + If a more powerful computer is developed Makes production easier (and cheaper) - If stronger pollution controls are required Makes production harder (and costly)
 - If stronger pollution controls are required Makes production harder (and costly)")
35
3Elements of Nature/Prices of other goods Shift resources away from high production cost goods. Caused by natural disasters or market price of other goods

36
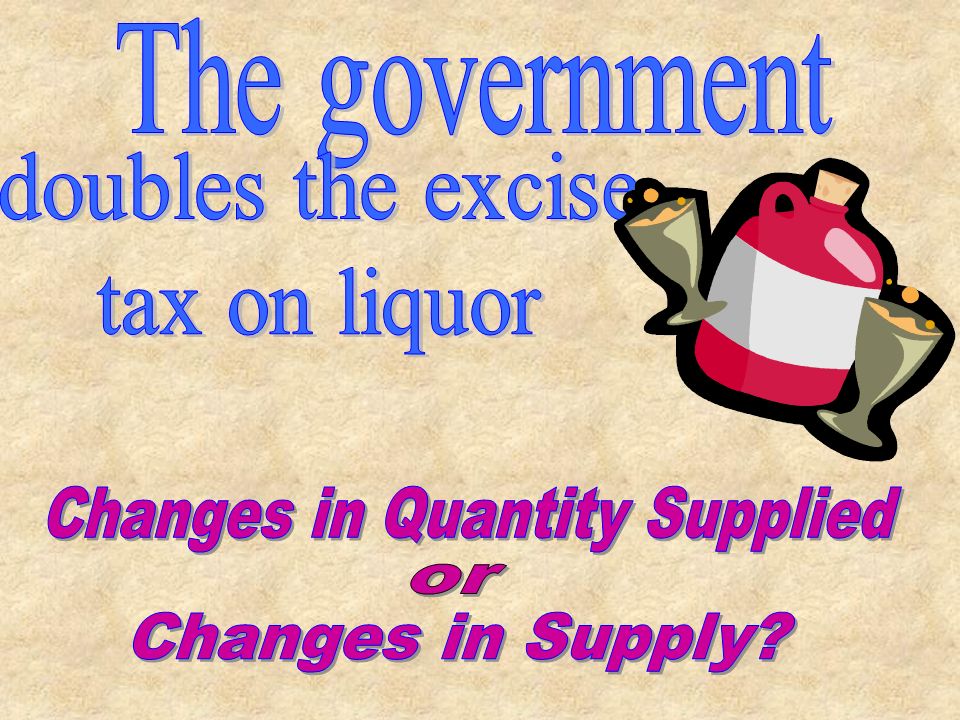
+ subsidies encourage production Taxes and Subsidies - taxes discourage production 4

37
5Number of Producers -fewer firms decrease supply +more firms increase supply

38
6Producer Expectations - if prices are expected to increase, more production about prices and resource availability - if prices are expected to decrease, less production

39
Response to a Change in the Price of the good Caused by factors related to consumers Movement ALONG the curve Quantity $6 $5 $4 $3 $2 $1 1234 5 6 0 Supply Current Price Price P1P1 P2P2 P3P3 Q2Q2 Q1Q1 Q3Q3

40
1 Resource Prices Why the curve shifts 2 Changes in Technology 3Prices of other goods Taxes and Subsidies 4 5Number of Producers

44
Quantity $6 $5 $4 $3 $2 $1 1234 5 6 0 Demand Current Equilibrium Price P Q decrease increase P1P1 P2P2 P3P3 Q2Q2 Q1Q1 Q3Q3 Supply Caused by a change in a Determinant of Supply Shifting the Supply Curve

45
Quantity $6 $5 $4 $3 $2 $1 1234 5 6 0 Supply Current Equilibrium Price P1P1 P2P2 P3P3 Q3Q3 Q1Q1 Q2Q2 Caused by a change in a Determinant of Demand Shifting the Demand Curve decrease increase Demand P Q

Similar presentations