Download presentation
Presentation is loading. Please wait.

1
Sequence Alignment

2
G - AGTA 0-2-3-4 A10 -2 T 0010 A-3 02 F(i,j) i = 0 1 2 3 4 Example x = AGTAm = 1 y = ATAs = -1 d = -1 j = 0 1 2 3 F(1, 1) = max{F(0,0) + s(A, A), F(0, 1) – d, F(1, 0) – d} = max{0 + 1, – 1, – 1} = 1 AAAA TTTT AAAA
 i = Example x = AGTAm = 1 y = ATAs = -1 d = -1 j = F(1, 1) = max{F(0,0) + s(A, A), F(0, 1) – d, F(1, 0) – d} = max{0 + 1, – 1, – 1} = 1 AAAA TTTT AAAA")
3
The Needleman-Wunsch Matrix x 1 ……………………………… x M y 1 ……………………………… y N Every nondecreasing path from (0,0) to (M, N) corresponds to an alignment of the two sequences An optimal alignment is composed of optimal subalignments
 to (M, N) corresponds to an alignment of the two sequences An optimal alignment is composed of optimal subalignments")
4
Scoring Matrix: Example ARNK A5-2 R-7 3 N--70 K---6 Notice that although R and K are different amino acids, they have a positive score. Why? They are both positively charged amino acids will not greatly change function of protein.

5
PAM Point Accepted Mutation (Dayhoff et al.) 1 PAM = PAM 1 = 1% average change of all amino acid positions After 100 PAMs of evolution, not every residue will have changed some residues may have mutated several times some residues may have returned to their original state some residues may not changed at all
 1 PAM = PAM 1 = 1% average change of all amino acid positions After 100 PAMs of evolution, not every residue will have changed some residues may have mutated several times some residues may have returned to their original state some residues may not changed at all")
6
PAM X PAM x = PAM 1 x PAM 250 = PAM 1 250 PAM 250 is a widely used scoring matrix: Ala Arg Asn Asp Cys Gln Glu Gly His Ile Leu Lys... A R N D C Q E G H I L K... Ala A 13 6 9 9 5 8 9 12 6 8 6 7... Arg R 3 17 4 3 2 5 3 2 6 3 2 9 Asn N 4 4 6 7 2 5 6 4 6 3 2 5 Asp D 5 4 8 11 1 7 10 5 6 3 2 5 Cys C 2 1 1 1 52 1 1 2 2 2 1 1 Gln Q 3 5 5 6 1 10 7 3 7 2 3 5... Trp W 0 2 0 0 0 0 0 0 1 0 1 0 Tyr Y 1 1 2 1 3 1 1 1 3 2 2 1 Val V 7 4 4 4 4 4 4 4 5 4 15 10

7
BLOSUM Blocks Substitution Matrix Scores derived from observations of the frequencies of substitutions in blocks of local alignments in related proteins Matrix name indicates evolutionary distance BLOSUM62 was created using sequences sharing no more than 62% identity

8
The Blosum50 Scoring Matrix

9
Local Alignment: Free Rides Vertex (0,0) The dashed edges represent the free rides from (0,0) to every other node. Yeah, a free ride!

10
The Local Alignment Recurrence The largest value of s i,j over the whole edit graph is the score of the best local alignment. The recurrence: 0 s i,j = max s i-1,j-1 + δ (v i, w j ) s i-1,j + δ (v i, -) s i,j-1 + δ (-, w j ) Notice there is only this change from the original recurrence of a Global Alignment
 s i-1,j + δ (v i, -) s i,j-1 + δ (-, w j ) Notice there is only this change from the original recurrence of a Global Alignment.")
11
The local alignment problem Given two strings x = x 1 ……x M, y = y 1 ……y N Find substrings x’, y’ whose similarity (optimal global alignment value) is maximum x = aaaacccccggggtta y = ttcccgggaaccaacc
 is maximum x = aaaacccccggggtta y = ttcccgggaaccaacc")
12
The Smith-Waterman algorithm Idea: Ignore badly aligning regions Modifications to Needleman-Wunsch: Initialization:F(0, j) = F(i, 0) = 0 0 Iteration:F(i, j) = max F(i – 1, j) – d F(i, j – 1) – d F(i – 1, j – 1) + s(x i, y j )
 = F(i, 0) = 0 0 Iteration:F(i, j) = max F(i – 1, j) – d F(i, j – 1) – d F(i – 1, j – 1) + s(x i, y j )")
13
Affine Gap Penalties In nature, a series of k indels often come as a single event rather than a series of k single nucleotide events: Normal scoring would give the same score for both alignments This is more likely. This is less likely.

14
Affine gaps (n) = d + (n – 1) e | | gap gap openextend To compute optimal alignment, F(i, j):score of alignment x 1 …x i to y 1 …y j if if x i aligns to y j if G(i, j):score if x i aligns to a gap after y j if H(i, j): score if y j aligns to a gap after x i V(i, j) = best score of alignment x 1 …x i to y 1 …y j d e (n)
 = d + (n – 1) e | | gap gap openextend To compute optimal alignment, F(i, j):score of alignment x 1 …x i to y 1 …y j if if x i aligns to y j if G(i, j):score if x i aligns to a gap after y j if H(i, j): score if y j aligns to a gap after x i V(i, j) = best score of alignment x 1 …x i to y 1 …y j d e (n)")
15
Needleman-Wunsch with affine gaps Initialization:V(i, 0) = d + (i – 1) e V(0, j) = d + (j – 1) e Iteration: V(i, j) = max{ F(i, j), G(i, j), H(i, j) } F(i, j) = V(i – 1, j – 1) + s(x i, y j ) V(i, j – 1) – d G(i, j) = max G(i, j – 1) – e V(i – 1, j) – d H(i, j) = max H(i – 1, j) – e Termination: similar
 = d + (i – 1) e V(0, j) = d + (j – 1) e Iteration: V(i, j) = max{ F(i, j), G(i, j), H(i, j) } F(i, j) = V(i – 1, j – 1) + s(x i, y j ) V(i, j – 1) – d G(i, j) = max G(i, j – 1) – e V(i – 1, j) – d H(i, j) = max H(i – 1, j) – e Termination: similar")
16
Pairwise Alignment Tools

17
What Is a Dot Plot ? A dot plot is a graphic representation of pairwise similarity The simplicity of dot plots prevents artifacts Ideal for looking for features that may come in different orders Reveal complex patterns Benefit from the most sophisticated statistical-analysis tool in the universe... your brain

19
What Can You Analyze with a Dot Plot ? Any pair of sequences DNA Proteins RNA DNA with proteins Dotlet is an appropriate tool To compare full genomes, install the program locally

20
Some Typical Dot-plot Comparisons Divergent sequences where only a segment is homologous Long insertions and deletions Tandem repeats The square shape of the pattern is characteristic of these repeats

21
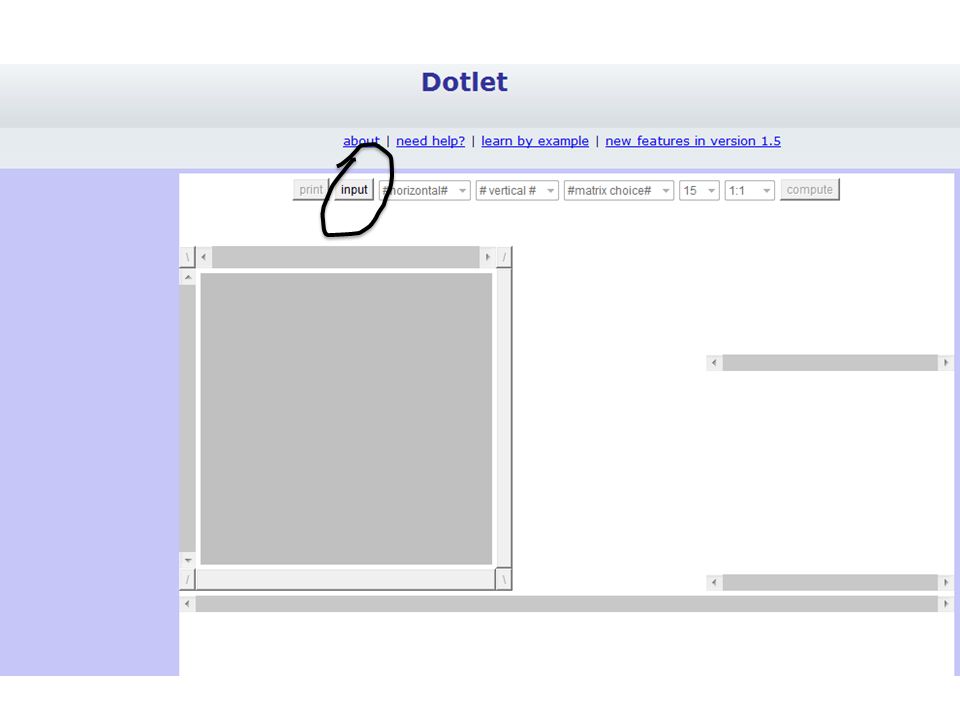
Using Dotlet Dotlet is one of the handiest tools for making dot plots Dotlet is a Java applet Open and download the applet at the following site: http://myhits.isb-sib.ch/cgi-bin/dotlet Use Firefox or IE

25
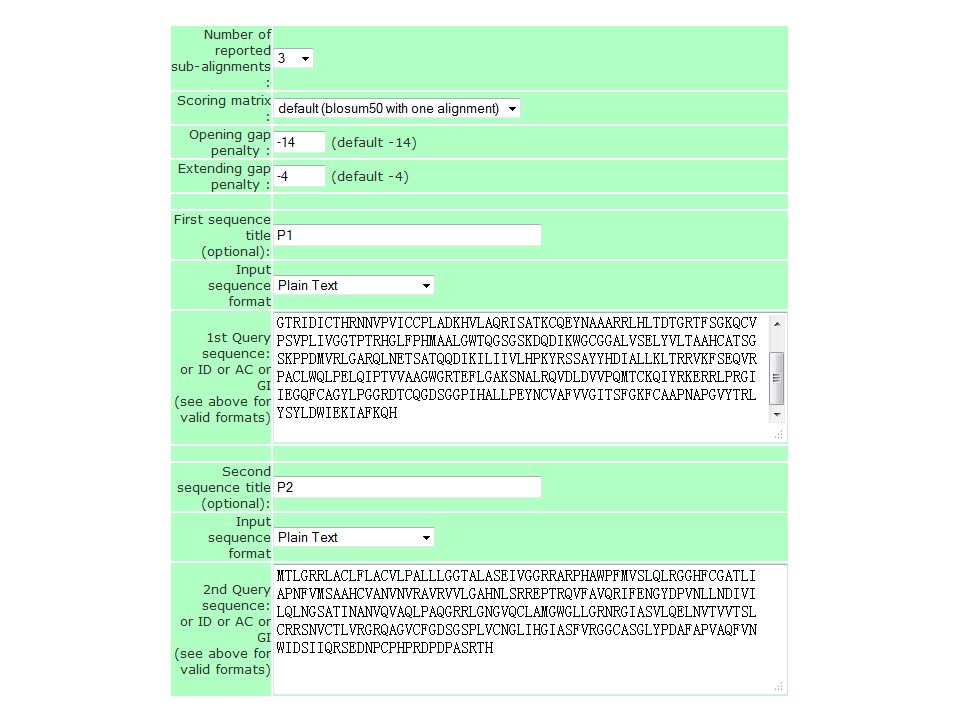
Two Protein Sequences MIILWSLIVHLQLTCLHLILQTPNLEALDALEIINYQTTKYTIPEVWKEQPVATIGEDVD DQDTEDEESYLKFGDDAEVRTSVSEGLHEGAFCRRSFDGRSGYCILAYQCLHVIREYRVH GTRIDICTHRNNVPVICCPLADKHVLAQRISATKCQEYNAAARRLHLTDTGRTFSGKQCV PSVPLIVGGTPTRHGLFPHMAALGWTQGSGSKDQDIKWGCGGALVSELYVLTAAHCATSG SKPPDMVRLGARQLNETSATQQDIKILIIVLHPKYRSSAYYHDIALLKLTRRVKFSEQVR PACLWQLPELQIPTVVAAGWGRTEFLGAKSNALRQVDLDVVPQMTCKQIYRKERRLPRGI IEGQFCAGYLPGGRDTCQGDSGGPIHALLPEYNCVAFVVGITSFGKFCAAPNAPGVYTRL YSYLDWIEKIAFKQH MTLGRRLACLFLACVLPALLLGGTALASEIVGGRRARPHAWPFMVSLQLRGGHFCGATLI APNFVMSAAHCVANVNVRAVRVVLGAHNLSRREPTRQVFAVQRIFENGYDPVNLLNDIVI LQLNGSATINANVQVAQLPAQGRRLGNGVQCLAMGWGLLGRNRGIASVLQELNVTVVTSL CRRSNVCTLVRGRQAGVCFGDSGSPLVCNGLIHGIASFVRGGCASGLYPDAFAPVAQFVN WIDSIIQRSEDNPCPHPRDPDPASRTH

26
Window size Dot plot window Alignment window Threshold window for fine tuning

27
Set Dotlet Parameters Dotlet slides a window along each sequence If the windows are more similar than the threshold, Dotlet prints a dot at their intersection You can control the similarity threshold with the little window on the left Threshold Window Size Window size Threshold

28
Window size Dot plot window Alignment window Threshold window for fine tuning

29
The Dotlet Threshold Every dot has a score given by the window comparison When the score is Below threshold 1 black dot Between thresholds 1 and 2 grey dot Above threshold 2 white dot The blue curve is the distribution of scores in the sequences The peak most common score, Most common less informative Log curve

30
Window size Dot plot window Alignment window Threshold window for fine tuning

31
Getting Your Dot Plot Right Window size and the stringency control the aspect of your dot plot Very stringent = clean dot plot, little signal Not stringent enough = noisy dot plot, too much signal Play with the threshold until a usable signal appears

32
Which Size for the Window? Long window Clean dot plots Little sensitivity Short window Noisy dot plots Very sensitive The size of the window should be in the range of the elements you are looking for Conserved domains: 50 amino acids Transmembrane segments: 20 amino acids Shorten the window to compare distantly related sequences

33
Window size Dot plot window Alignment window Threshold window for fine tuning

34
Looking at Repeated Domains with Dotlet The square shape is typical of tandem repeats The repeats are not perfect because the sequences have diverged after their duplication

35
Comparing a Gene and Its Product Eukaryotic genes are transcribed into RNA The RNA is then spliced to remove the introns’ sequences It may be necessary to compare the gene and its product Dotlet makes this comparative analysis easy

36
Aligning Sequences Dotlet dot plots are a good way to provide an overview Dot plots don’t provide residue/residue analysis For this analysis you need an alignment The most convenient tool for making precise local alignments is Lalign

37
Lalign and BLAST Lalign is like a very precise BLAST It works on only two sequences at a time You must provide both sequences

38
LaLign http://www.ch.embnet.org/software/LALIGN_form.html

41
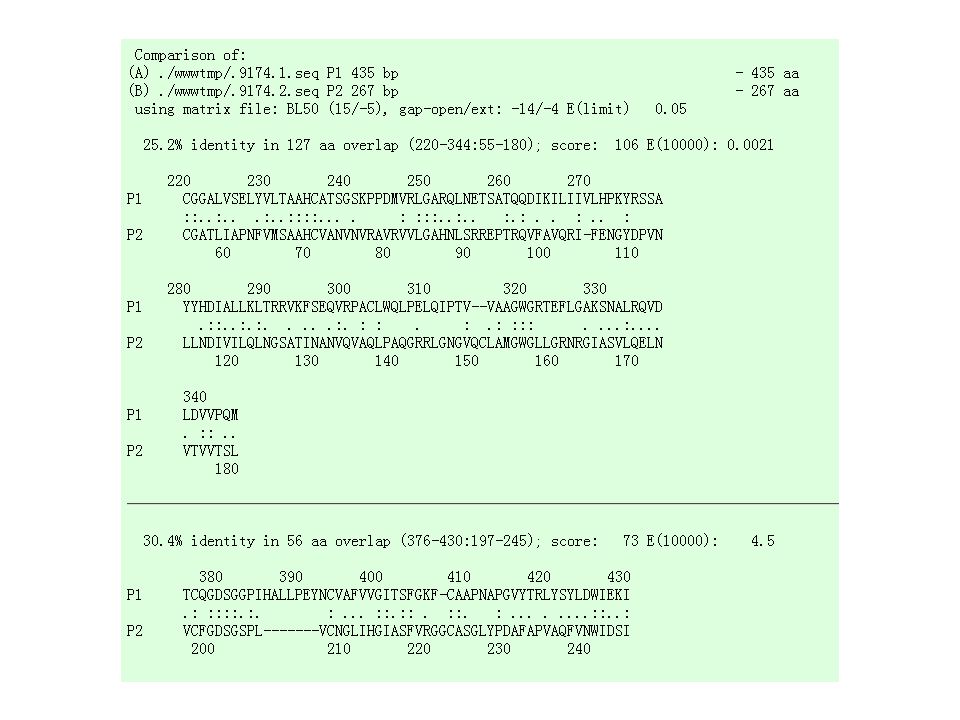
Lalign Output Lalign produces an output similar to the alignment section of BLAST The E-value indicates the significance of each alignment Low E-value good alignment

43
Going Farther If you need to align coding DNA with a protein, try these sites: www.tcoffee.org => protogene coot.embl.de/pal2nal If you need to align very large sequences, try this site: www.ncbi.nlm.nih.gov/blast/bl2seq/wblast2.cgi If you need a precise estimate of your alignment’s statistical significance, use PRSS The program is available at fasta.bioch.virginia.edu

44
Multiple Alignment

45
Generalizing the Notion of Pairwise Alignment Alignment of 2 sequences is represented as a 2-row matrix In a similar way, we represent alignment of 3 sequences as a 3-row matrix A T _ G C G _ A _ C G T _ A A T C A C _ A Score: more conserved columns, better alignment

46
Alignments = Paths in … Align 3 sequences: ATGC, AATC,ATGC AAT--C A TGC ATGC

47
Alignment Paths 011234 AAT--C A TGC ATGC x coordinate

48
Alignment Paths Align the following 3 sequences: ATGC, AATC,ATGC 011234 012334 AAT--C A TGC ATGC x coordinate y coordinate

49
Alignment Paths 011234 012334 AAT--C A TGC 001234 ATGC Resulting path in (x,y,z) space: (0,0,0) (1,1,0) (1,2,1) (2,3,2) (3,3,3) (4,4,4) x coordinate y coordinate z coordinate
 space: (0,0,0) (1,1,0) (1,2,1) (2,3,2) (3,3,3) (4,4,4) x coordinate y coordinate z coordinate")
50
Aligning Three Sequences Same strategy as aligning two sequences Use a 3-D “”, with each axis representing a sequence to align For global alignments, go from source to sink source sink

51
2-D vs 3-D Alignment Grid V W 2-D edit graph 3-D edit graph

52
2-D cell versus 2-D Alignment Cell In 3-D, 7 edges in each unit cube In 2-D, 3 edges in each unit square

53
Architecture of 3-D Alignment Cell (i-1,j-1,k- 1) (i,j-1,k- 1) (i,j-1,k) (i-1,j-1,k) (i-1,j,k) (i,j,k) (i-1,j,k-1) (i,j,k-1)
 (i,j-1,k- 1) (i,j-1,k) (i-1,j-1,k) (i-1,j,k) (i,j,k) (i-1,j,k-1) (i,j,k-1)")
54
Multiple Alignment: Dynamic Programming s i,j,k = max (x, y, z) is an entry in the 3-D scoring matrix s i-1,j-1,k-1 + (v i, w j, u k ) s i-1,j-1,k + (v i, w j, _ ) s i-1,j,k-1 + (v i, _, u k ) s i,j-1,k-1 + (_, w j, u k ) s i-1,j,k + (v i, _, _) s i,j-1,k + (_, w j, _) s i,j,k-1 + (_, _, u k ) cube diagonal: no indels face diagonal: one indel edge diagonal: two indels
 is an entry in the 3-D scoring matrix s i-1,j-1,k-1 + (v i, w j, u k ) s i-1,j-1,k + (v i, w j, _ ) s i-1,j,k-1 + (v i, _, u k ) s i,j-1,k-1 + (_, w j, u k ) s i-1,j,k + (v i, _, _) s i,j-1,k + (_, w j, _) s i,j,k-1 + (_, _, u k ) cube diagonal: no indels face diagonal: one indel edge diagonal: two indels")
55
Multiple Alignment: Running Time For 3 sequences of length n, the run time is 7n 3 ; O(n 3 ) For k sequences, build a k-dimensional Manhattan, with run time (2 k -1)(n k ); O(2 k n k ) Conclusion: dynamic programming approach for alignment between two sequences is easily extended to k sequences but it is impractical due to exponential running time
 For k sequences, build a k-dimensional Manhattan, with run time (2 k -1)(n k ); O(2 k n k ) Conclusion: dynamic programming approach for alignment between two sequences is easily extended to k sequences but it is impractical due to exponential running time")
56
Multiple Alignment Induces Pairwise Alignments Every multiple alignment induces pairwise alignments x:AC-GCGG-C y:AC-GC-GAG z:GCCGC-GAG Induces: x: ACGCGG-C; x: AC-GCGG-C; y: AC-GCGAG y: ACGC-GAC; z: GCCGC-GAG; z: GCCGCGAG

57
Reverse Problem: Constructing Multiple Alignment from Pairwise Alignments Given 3 arbitrary pairwise alignments: x: ACGCTGG-C; x: AC-GCTGG-C; y: AC-GC-GAG y: ACGC--GAC; z: GCCGCA-GAG; z: GCCGCAGAG can we construct a multiple alignment that induces them?

58
Reverse Problem: Constructing Multiple Alignment from Pairwise Alignments Given 3 arbitrary pairwise alignments: x: ACGCTGG-C; x: AC-GCTGG-C; y: AC-GC-GAG y: ACGC--GAC; z: GCCGCA-GAG; z: GCCGCAGAG can we construct a multiple alignment that induces them? NOT ALWAYS Pairwise alignments may be inconsistent

59
Inferring Multiple Alignment from Pairwise Alignments From an optimal multiple alignment, we can infer pairwise alignments between all pairs of sequences, but they are not necessarily optimal It is difficult to infer a ``good” multiple alignment from optimal pairwise alignments between all sequences

60
Combining Optimal Pairwise Alignments into Multiple Alignment Can combine pairwise alignments into multiple alignment Can not combine pairwise alignments into multiple alignment

61
Profile Representation of Multiple Alignment - A G G C T A T C A C C T G T A G – C T A C C A - - - G C A G – C T A C C A - - - G C A G – C T A T C A C – G G C A G – C T A T C G C – G G A 1 1.8 C.6 1.4 1.6.2 G 1.2.2.4 1 T.2 1.6.2 -.2.8.4.8.4

62
Profile Representation of Multiple Alignment In the past we were aligning a sequence against a sequence Can we align a sequence against a profile? Can we align a profile against a profile? - A G G C T A T C A C C T G T A G – C T A C C A - - - G C A G – C T A C C A - - - G C A G – C T A T C A C – G G C A G – C T A T C G C – G G A 1 1.8 C.6 1.4 1.6.2 G 1.2.2.4 1 T.2 1.6.2 -.2.8.4.8.4

63
Aligning alignments Given two alignments, can we align them? x GGGCACTGCAT y GGTTACGTC-- Alignment 1 z GGGAACTGCAG w GGACGTACC-- Alignment 2 v GGACCT-----

64
Aligning alignments Given two alignments, can we align them? Hint: use alignment of corresponding profiles x GGGCACTGCAT y GGTTACGTC-- Combined Alignment z GGGAACTGCAG w GGACGTACC-- v GGACCT-----

65
Multiple Alignment: Greedy Approach Choose most similar pair of strings and combine into a profile, thereby reducing alignment of k sequences to an alignment of of k-1 sequences/profiles. Repeat This is a heuristic greedy method u 1 = ACGTACGTACGT… u 2 = TTAATTAATTAA… u 3 = ACTACTACTACT… … u k = CCGGCCGGCCGG u 1 = ACg/tTACg/tTACg/cT… u 2 = TTAATTAATTAA… … u k = CCGGCCGGCCGG… k k-1

66
Greedy Approach: Example Consider these 4 sequences s1GATTCA s2GTCTGA s3GATATT s4GTCAGC

67
Greedy Approach: Example (cont’d) There are = 6 possible alignments s2 GTCTGA s4 GTCAGC (score = 2) s1 GAT-TCA s2 G-TCTGA (score = 1) s1 GAT-TCA s3 GATAT-T (score = 1) s1 GATTCA-- s4 G—T-CAGC(score = 0) s2 G-TCTGA s3 GATAT-T (score = -1) s3 GAT-ATT s4 G-TCAGC (score = -1)
 There are = 6 possible alignments s2 GTCTGA s4 GTCAGC (score = 2) s1 GAT-TCA s2 G-TCTGA (score = 1) s1 GAT-TCA s3 GATAT-T (score = 1) s1 GATTCA-- s4 G—T-CAGC(score = 0) s2 G-TCTGA s3 GATAT-T (score = -1) s3 GAT-ATT s4 G-TCAGC (score = -1)")
68
Greedy Approach: Example (cont’d) s 2 and s 4 are closest; combine: s2GTCTGA s4GTCAGC s 2,4 GTC t/a G a/c A (profile) s 1 GATTCA s 3 GATATT s 2,4 GTC t/a G a/c new set of 3 sequences:
 s 2 and s 4 are closest; combine: s2GTCTGA s4GTCAGC s 2,4 GTC t/a G a/c A (profile) s 1 GATTCA s 3 GATATT s 2,4 GTC t/a G a/c new set of 3 sequences:")
69
Progressive Alignment Progressive alignment is a variation of greedy algorithm with a somewhat more intelligent strategy for choosing the order of alignments. Progressive alignment works well for close sequences, but deteriorates for distant sequences Gaps in consensus string are permanent Use profiles to compare sequences

70
ClustalW Popular multiple alignment tool today ‘W’ stands for ‘weighted’ (d ifferent parts of alignment are weighted differently). Three-step process 1.) Construct pairwise alignments 2.) Build Guide Tree 3.) Progressive Alignment guided by the tree
 Construct pairwise alignments 2.) Build Guide Tree 3.) Progressive Alignment guided by the tree.")
71
Step 1: Pairwise Alignment Aligns each sequence again each other giving a similarity matrix Similarity = exact matches / sequence length (percent identity) v 1 v 2 v 3 v 4 v 1 - v 2.17 - v 3.87.28 - v 4.59.33.62 - (.17 means 17 % identical)
 v 1 v 2 v 3 v 4 v 1 - v v v (.17 means 17 % identical)")
72
Step 2: Guide Tree Create Guide Tree using the similarity matrix ClustalW uses the neighbor-joining method Guide tree roughly reflects evolutionary relations

73
Step 2: Guide Tree (cont’d) v1v3v4v2v1v3v4v2 Calculate: v 1,3 = alignment (v 1, v 3 ) v 1,3,4 = alignment((v 1,3 ),v 4 ) v 1,2,3,4 = alignment((v 1,3,4 ),v 2 ) v 1 v 2 v 3 v 4 v 1 - v 2.17 - v 3.87.28 - v 4.59.33.62 -
 v1v3v4v2v1v3v4v2 Calculate: v 1,3 = alignment (v 1, v 3 ) v 1,3,4 = alignment((v 1,3 ),v 4 ) v 1,2,3,4 = alignment((v 1,3,4 ),v 2 ) v 1 v 2 v 3 v 4 v 1 - v v v")
74
Step 3: Progressive Alignment Start by aligning the two most similar sequences Following the guide tree, add in the next sequences, aligning to the existing alignment Insert gaps as necessary FOS_RAT PEEMSVTS-LDLTGGLPEATTPESEEAFTLPLLNDPEPK-PSLEPVKNISNMELKAEPFD FOS_MOUSE PEEMSVAS-LDLTGGLPEASTPESEEAFTLPLLNDPEPK-PSLEPVKSISNVELKAEPFD FOS_CHICK SEELAAATALDLG----APSPAAAEEAFALPLMTEAPPAVPPKEPSG--SGLELKAEPFD FOSB_MOUSE PGPGPLAEVRDLPG-----STSAKEDGFGWLLPPPPPPP-----------------LPFQ FOSB_HUMAN PGPGPLAEVRDLPG-----SAPAKEDGFSWLLPPPPPPP-----------------LPFQ.. : **. :.. *:.* *. * **: Dots and stars show how well-conserved a column is.

75
Multiple Alignments: Scoring Number of matches (multiple longest common subsequence score) Entropy score Sum of pairs (SP-Score)
 Entropy score Sum of pairs (SP-Score)")
76
Multiple LCS Score A column is a “match” if all the letters in the column are the same Only good for very similar sequences AAA AAT ATC

77
Entropy Define frequencies for the occurrence of each letter in each column of multiple alignment p A = 1, p T =p G =p C =0 (1 st column) p A = 0.75, p T = 0.25, p G =p C =0 (2 nd column) p A = 0.50, p T = 0.25, p C =0.25 p G =0 (3 rd column) Compute entropy of each column AAA AAT ATC
 p A = 0.75, p T = 0.25, p G =p C =0 (2 nd column) p A = 0.50, p T = 0.25, p C =0.25 p G =0 (3 rd column) Compute entropy of each column AAA AAT ATC")
78
Entropy: Example Best case Worst case

79
Multiple Alignment: Entropy Score Entropy for a multiple alignment is the sum of entropies of its columns: over all columns X=A,T,G,C p X logp X

80
Entropy of an Alignment: Example column entropy: -( p A logp A + p C logp C + p G logp G + p T logp T ) Column 1 = -[1*log(1) + 0*log0 + 0*log0 +0*log0] = 0 Column 2 = -[( 1 / 4 )*log( 1 / 4 ) + ( 3 / 4 )*log( 3 / 4 ) + 0*log0 + 0*log0] = -[ ( 1 / 4 )*(-2) + ( 3 / 4 )*(-.415) ] = +0.811 Column 3 = -[( 1 / 4 )*log( 1 / 4 )+( 1 / 4 )*log( 1 / 4 )+( 1 / 4 )*log( 1 / 4 ) +( 1 / 4 )*log( 1 / 4 )] = 4* -[( 1 / 4 )*(-2)] = +2.0 Alignment Entropy = 0 + 0.811 + 2.0 = +2.811 AAA ACC ACG ACT
![Entropy of an Alignment: Example column entropy: -( p A logp A + p C logp C + p G logp G + p T logp T ) Column 1 = -[1*log(1) + 0*log0 + 0*log0 +0*log0] = 0 Column 2 = -[( 1 / 4 )*log( 1 / 4 ) + ( 3 / 4 )*log( 3 / 4 ) + 0*log0 + 0*log0] = -[ ( 1 / 4 )*(-2) + ( 3 / 4 )*(-.415) ] = Column 3 = -[( 1 / 4 )*log( 1 / 4 )+( 1 / 4 )*log( 1 / 4 )+( 1 / 4 )*log( 1 / 4 ) +( 1 / 4 )*log( 1 / 4 )] = 4* -[( 1 / 4 )*(-2)] = +2.0 Alignment Entropy = = AAA ACC ACG ACT](http://images.slideplayer.com/25/8148368/slides/slide_80.jpg "Entropy of an Alignment: Example column entropy: -( p A logp A + p C logp C + p G logp G + p T logp T ) Column 1 = -[1*log(1) + 0*log0 + 0*log0 +0*log0] = 0 Column 2 = -[( 1 / 4 )*log( 1 / 4 ) + ( 3 / 4 )*log( 3 / 4 ) + 0*log0 + 0*log0] = -[ ( 1 / 4 )*(-2) + ( 3 / 4 )*(-.415) ] = Column 3 = -[( 1 / 4 )*log( 1 / 4 )+( 1 / 4 )*log( 1 / 4 )+( 1 / 4 )*log( 1 / 4 ) +( 1 / 4 )*log( 1 / 4 )] = 4* -[( 1 / 4 )*(-2)] = +2.0 Alignment Entropy = = AAA ACC ACG ACT")
81
Multiple Alignment Induces Pairwise Alignments Every multiple alignment induces pairwise alignments x:AC-GCGG-C y:AC-GC-GAG z:GCCGC-GAG Induces: x: ACGCGG-C; x: AC-GCGG-C; y: AC-GCGAG y: ACGC-GAC; z: GCCGC-GAG; z: GCCGCGAG

82
Inferring Pairwise Alignments from Multiple Alignments From a multiple alignment, we can infer pairwise alignments between all sequences, but they are not necessarily optimal This is like projecting a 3-D multiple alignment path on to a 2-D face of the cube

83
Multiple Alignment Projections A 3-D alignment can be projected onto the 2-D plane to represent an alignment between a pair of sequences. All 3 Pairwise Projections of the Multiple Alignment

84
Sum of Pairs Score(SP-Score) Consider pairwise alignment of sequences a i and a j imposed by a multiple alignment of k sequences Denote the score of this suboptimal (not necessarily optimal) pairwise alignment as s*(a i, a j ) Sum up the pairwise scores for a multiple alignment: s(a 1,…,a k ) = Σ i,j s*(a i, a j )
 Consider pairwise alignment of sequences a i and a j imposed by a multiple alignment of k sequences Denote the score of this suboptimal (not necessarily optimal) pairwise alignment as s*(a i, a j ) Sum up the pairwise scores for a multiple alignment: s(a 1,…,a k ) = Σ i,j s*(a i, a j )")
85
Computing SP-Score Aligning 4 sequences: 6 pairwise alignments Given a 1,a 2,a 3,a 4 : s(a 1 …a 4 ) = s*(a i,a j ) = s*(a 1,a 2 ) + s*(a 1,a 3 ) + s*(a 1,a 4 ) + s*(a 2,a 3 ) + s*(a 2,a 4 ) + s*(a 3,a 4 )
 = s*(a i,a j ) = s*(a 1,a 2 ) + s*(a 1,a 3 ) + s*(a 1,a 4 ) + s*(a 2,a 3 ) + s*(a 2,a 4 ) + s*(a 3,a 4 )")
86
SP-Score: Example a1.aka1.ak ATG-C-AAT A-G-CATAT ATCCCATTT Pairs of Sequences A AA 11 1 G CG 1 Score=3 Score = 1 – Column 1 Column 3 ss*(s*( To calculate each column:

87
Multiple Alignment: History 1975 Sankoff Formulated multiple alignment problem and gave dynamic programming solution 1988 Carrillo-Lipman Branch and Bound approach for MSA 1990 Feng-Doolittle Progressive alignment 1994 Thompson-Higgins-Gibson-ClustalW Most popular multiple alignment program 1998 Morgenstern et al.-DIALIGN Segment-based multiple alignment 2000 Notredame-Higgins-Heringa-T-coffee Using the library of pairwise alignments 2004 MUSCLE What’s next?

Similar presentations


 (Lecture for CS498-CXZ Algorithms in Bioinformatics) Oct. 6, 2005 ChengXiang Zhai Department of Computer Science University.>")
 I519 Introduction to Bioinformatics, Fall 2012.>")


 sequences of a query sequence in a sequence of database Input: query sequence & database Output: hits.>")


