Download presentation
Presentation is loading. Please wait.

1
Optical Measurements & K d values Elizabeth Cox 29 November 2010

2
How is Light Measured? Optical measurements are based on light penetration through the water column ◦ Scalar irradiance sensor- PAR region of spectrum ◦ Vector irradiance sensor (cosine collector) Measure scalar irradiance ◦ 2 π - surface (on deck of boat) ◦ 4 π - water column at varying depths Determine the diffuse attenuation coefficient (K d )
 Measure scalar irradiance ◦ 2 π - surface (on deck of boat) ◦ 4 π - water column at varying depths Determine the diffuse attenuation coefficient (K d ).")
3
Instrumentation: 2 π and 4 π scalar irradiance sensors 4π4π 2π2π

4
Instrumentation: 2 π scalar irradiance sensor

5
Instrumentation: 4 π scalar irradiance sensor

6
Irradiance Amount of light ◦ Exponential relationship with depth Units: µEinm -2 s -1 Measurements taken in the field: ◦ Surface- deck of ship ◦ Deep- water column 0.5, 1, 2, 3, 4, 4, 3, 2, 1, 0.5 (meters)
")
7
Example: Irradiance vs Depth

8
Light Attenuation Decrease in light intensity with depth in the water column Dependent on amount of light absorbed or scattered ◦ Absorbs: water, CDOM, suspended sediments, phytoplankton ◦ Scatters: water, suspended sediments, small phytoplankton and bacteria

9
Diffuse attenuation coefficient (K d ) Attenuation coefficient- quantifies the rate at which light is attenuated Apparent optical property ◦ Magnitude is a function of optical properties of water and light direction ◦ Not always constant with depth ◦ Varies by location Units: m -1
 Attenuation coefficient- quantifies the rate at which light is attenuated Apparent optical property ◦ Magnitude is a function of optical properties of water and light direction ◦ Not always constant with depth ◦ Varies by location Units: m -1")
10
Diffuse attenuation coefficient (K d ) continued Depends on solar angle of light reflection ◦ Dependence is small so we neglect it in our measurements ◦ Simultaneous air and water measurement taken to reduce dependence Larger K d = more light attenuated ◦ Phytoplankton production is low in estuary of LCFR http://uncw.edu/cms/aquaticecology/laboratory/lcfrp/WQ%20Reports/LCFRP%202005%20report/LCFRP%202005%20Complet ed%20Report.pdf
 continued Depends on solar angle of light reflection ◦ Dependence is small so we neglect it in our measurements ◦ Simultaneous air and water measurement taken to reduce dependence Larger K d = more light attenuated ◦ Phytoplankton production is low in estuary of LCFR ed%20Report.pdf")
11
Errors in K d values Fluctuations in incoming light ◦ Correct by: 1.Two system to normalize (air and water data) Perturbations by ship (shading) ◦ Correct by: 1.Leaning over side of ship to take measurements 2.Take measurements from sunny side of ship
 Perturbations by ship (shading) ◦ Correct by: 1.Leaning over side of ship to take measurements 2.Take measurements from sunny side of ship")
12
Steps to Determine K d 1. Take light measurements in the field 2. Calculate ln(Ed(0)/Ed(z)) 3. Calculate K d using the ln(Ed(0)/Ed(z)) data from any two depths
/Ed(z)) 3. Calculate K d using the ln(Ed(0)/Ed(z)) data from any two depths.")
13
Example: Determination of K d Station 61Date: 9/13/10Time: 11:05 amCruise 1 Depth (m)Deck (PAR) Ed(0)Watercolumn (PAR) Ed(z)ln Ed(0)/Ed(z) 0.52444766.31.1598 1.02449288.12.1401 2.0244941.854.0693 3.024487.1935.8299 4.024431.05897.7438 4.024451.057.7530 3.024485.5946.0813 2.0244639.264.1320 1.02443231.52.3564 0.52441697.71.2524 K d = (2.1401- 1.1598)/(1.0-0.5) = 1.96 m -1
Deck (PAR) Ed(0)Watercolumn (PAR) Ed(z)ln Ed(0)/Ed(z) K d = ( )/( ) = 1.96 m -1")
14
K d values for 2010 StationCruise 1 (September)Cruise 2 (November) M18 0.7331.311 M23 1.0701.303 M35 1.7902.200 M42 1.6502.099 M54 2.2002.090 M61 1.8602.230 HB 2.2803.429
Cruise 2 (November) M M M M M M HB")
15
Example: K d vs Depth

16
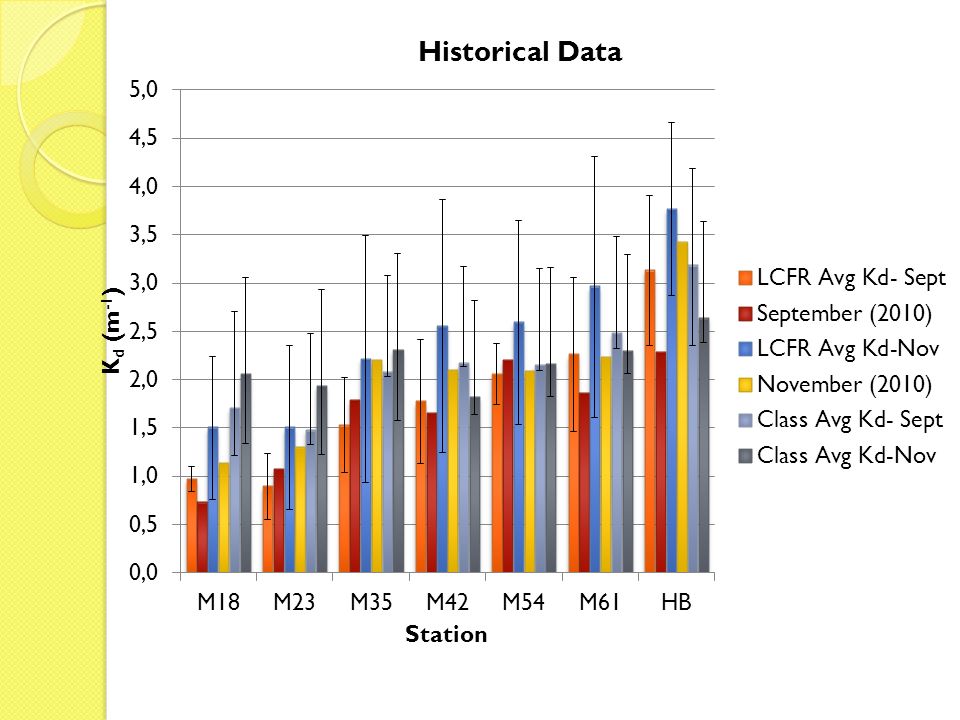
YearHBM61M54M42M35M23M18 LCFR dataSeptNovSeptNovSeptNovSeptNovSeptNovSeptNovSeptNov 20052.824.762.314.342.373.721.613.981.713.531.162.231.022.14 20072.563.011.441.641.741.621.231.40.980.970.510.570.830.69 20084.023.543.032.912.072.442.482.281.912.141.011.711.071.68 average3.1333.7702.2602.9632.0602.5931.7732.5531.5332.2130.8931.5030.9731.503 Class data Cruise 1 Cruise 2 Cruise 1 Cruise 2 Cruise 1 Cruise 2 Cruise 1 Cruise 2 Cruise 1 Cruise 2 Cruise 1 Cruise 2 Cruise 1 Cruise 2 20083.772.812.372.132.191.922.21.692.112.821.582.432.052.56 20092.62.462.592.462.112.42.151.952.051.791.371.431.361.55 average3.1852.6352.482.2952.152.162.1751.822.082.3051.4751.931.7052.055 20102.283.4291.862.232.22.091.652.0991.792.21.071.3030.7331.311 Historical K d values

18
Relationship: K d & Salinity K d decreases with increasing salinity Salinity and DOC are often inversely related ◦ Relationship shows that chromophoric carbon (CDOM) is a major factor in absorption of light
 is a major factor in absorption of light")
19
Relationship: K d & Salinity Cruise 1Cruise 2 StationSalinityKdSalinityKd m18 35.70.73332.91.311 m2335.51.0733.51.303 m3530.31.7925.82.2 m4227.11.6522.32.099 m5421.82.215.92.09 m6118.41.869.52.23 HB7.92.289.83.429 M18

20
Relationship: K d & DOC K d increases with increasing DOC concentration due to chromophoric carbon increase ◦ Intensity of light in water column decreases

23
Relationship: K d & turbidity K d increases with increasing turbidity Intensity of light decreases in more turbid waters Suspended sediments scatter light in all directions

24
M18 M23 M54

25
M23

26
Conclusions: Intensity of light in water column decreases as a function of depth due to: ◦ High CDOM concentrations ◦ Turbid water Station HB- more turbid, high CDOM concentration more light is attenuated (large K d value)
")
27
Thanks for your attention!

Similar presentations


 Phytoplankton & Primary Production Dr Purdie SOC (566/18) LECTURE 6 Week 6 (i) Photosynthesis & Light (ii) Critical.>")


