Download presentation
Presentation is loading. Please wait.

1
pH

3
Each change in pH really means…

5
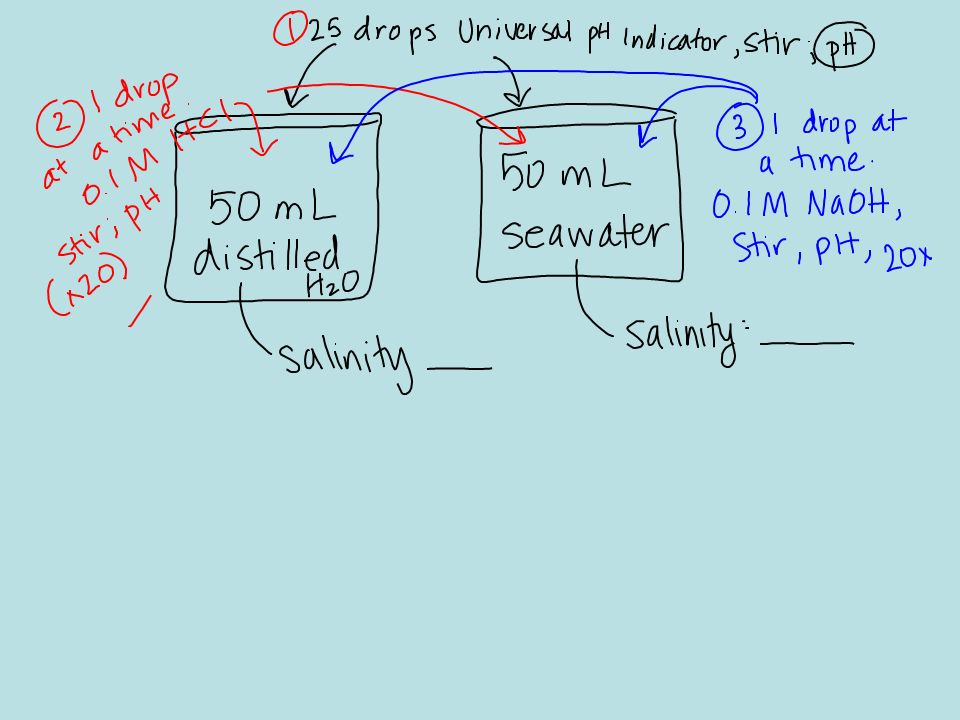
Water pH Lab

7
Look at your graph… What does it show you?

8
Seawater has a BUFFER! What is it? What causes it? How is seawater different from fresh water?

9
pH Buffer System

10
If acid is added (sewage output/volcanic activity) If alkaline solution is added
 If alkaline solution is added")
11
Photosynthesis?? Respiration??

12
Ocean Acidification

14
Ocean Acidification Lab & Case Study http://dataintheclassroom.noaa.gov/SitePa ges/oa/simulation#http://dataintheclassroom.noaa.gov/SitePa ges/oa/simulation# Bring a water sample tomorrow!

15
Videos!

17
Dissolved Oxygen (DO)
")
19
Seasonal DO variation –what could cause this variation?

20
Profile Graph

23
After The Storm Video 20 min

24
COMPARING WATER SAMPLES LAB How can we measure…. Salinity DO pH

25
CASE STUDY—THE DEAD ZONE Marine Issues--Homework

26
NOAA Dead Zone Video 4 min Eutrophication— Hypoxia— Dead Zone— Online Map Activity

27
What waterways connect to the Gulf? What smaller waterways connect to those? What natural processes could be contributing to water quality degradation and the development of the Gulf dead zone?

28
Make a Hypothesis What anthropogenic activities or materials could be contributing to water quality degradation and the development of the Gulf dead zone?

29
http://www.nationalatlas.gov/mapmaker?saved=T&left=- 5954010.16308408&right=4024783.32376774&top=4336078.07187835&botto m=- 2650901.64560656&mWidth=547&mHeight=383&visLayers=states%2Cusurba n%2Cgrid%2Clakesrive http://mapmaker.education.nationalgeogra phic.com/?ar_a=1&b=1&ls=00000000000 0#/http://mapmaker.education.nationalgeogra phic.com/?ar_a=1&b=1&ls=00000000000 0#/

30
What anthropogenic activities or materials could be contributing to water quality degradation and the development of the Gulf dead zone?

31
Turbidity

32
Measuring turbidity Taking a Secchi Disk ReadingUsing a Turbidity Sensor

33
Turbidity

35
1. average salinity of seawater_____ 2. average pH of seawater________ 3. range of pH in seawater___ to ___ 4. instrument to test seawater salinity______ 5. type of bond between water molecules____ 6. type of molecule water is:___________ 7. area in the ocean with drastic change in salinity___________ 8. area in the ocean with drastic change in density____________ 9. What type of graphs do we use to show changes as you go down in the ocean?_______ 10. What units do we use for salinity?_____

36
Magic numbers!!!!!!!! Salinity –avg 35 ppt DO –avg 5 – 6 ppm (2ppm hypoxic; 0ppm anoxic) pH –avg 8 (7.5 – 8.4)
 pH –avg 8 (7.5 – 8.4).")
38
CELEBRATION OF KNOWLEDGE TOMORROW!!!

39
Thanks to the following websites for photos and information: http://mddnr.chesapeakebay.net/eyesonthebay/whatsitm ean.cfm http://www.bigelow.org/virtual/heat_cap.jpg http://schc.sc.edu/mare/estuaries.htm http://waterontheweb.org/under/waterquality/turbidity. html http://www.indiana.edu/%7Eg131/chem6.gif http://www.whoi.edu/OCB-OA/page.do?pid=112076

Similar presentations


>")

 Depends on…>")
 and neutrons (0) Electrons (-)>")
 - dissolves solids and gases readily (“universal solvent”) Last time (Wednesday)>")


 Pollution ➢ 2) temperature ➢ 3) dissolved oxygen.>")
 –Negative logarithm of the H+ concentration Higher the pH, the lower the H+ concentration.>")


