Download presentation
Presentation is loading. Please wait.

1
Section 4.1 Scatter Diagrams and Correlation

2
Definitions The Response Variable is the variable whose value can be explained by the value of the explanatory or predictor variable.

3
Scatter Diagram A graph that shows the relationship between two quantitative variables measured on the same individual. Each individual in the data set is represented by a point in the scatter diagram. The explanatory variable is plotted on the horizontal axis and the response variable is plotted on the vertical axis.

4
Finding Scatter Diagram 1.Put x values (explanatory variable) into L1 2.Put y values (response variable) into L2 3.“2 nd ” button, “y=“ button 4.“Enter” on 1: Plot1 5.Choose “On”, “1 st type”, L1, L2, “1 st mark” 6.“Zoom” -> ZoomStat
 into L1 2.Put y values (response variable) into L nd button, y= button 4. Enter on 1: Plot1 5.Choose On , 1 st type , L1, L2, 1 st mark 6. Zoom -> ZoomStat")
5
1. Find the scatter diagram for the following data XY 120 250 360 465

6
Positively vs. Negatively Associated Positively Associated = As the x value increases, the y value increases Negatively Associated = As the x value increases, the y value decreases where x = explanatory variable, y = response variable

7
Sample Linear Correlation Coefficient (r) or Pearson Product Moment Correlation Coefficient
 or Pearson Product Moment Correlation Coefficient")
8
2. Find the linear correlation coefficient (by hand) XY 110 215 835 1344
 XY")
9
Sample Linear Correlation Coefficient (r) or Pearson Product Moment Correlation Coefficient (shortcut formula)
 or Pearson Product Moment Correlation Coefficient (shortcut formula)")
10
Linear Correlation Coefficient Aka (Pearson Product Moment Correlation Coefficient) = a measure of the strength of the linear relation between two variables. Represented by r Between -1 and 1 (including -1 and 1) -1 represents perfect negative correlation, 1 represents perfect positive correlation
 -1 represents perfect negative correlation, 1 represents perfect positive correlation.")
11
Finding r 1.Put x values (explanatory variable) into L1 2.Put y values (response variable) into L2 3.“Stat” button 4.Right arrow to CALC 5.Down arrow to LinReg (ax + b) 6.“enter” button 7.“enter” button * Make sure Diagnostics is On
 into L1 2.Put y values (response variable) into L2 3. Stat button 4.Right arrow to CALC 5.Down arrow to LinReg (ax + b) 6. enter button 7. enter button * Make sure Diagnostics is On")
12
3. Find the linear correlation coefficient (by TI-83/84) XY 550 927 1115 3
 XY")
13
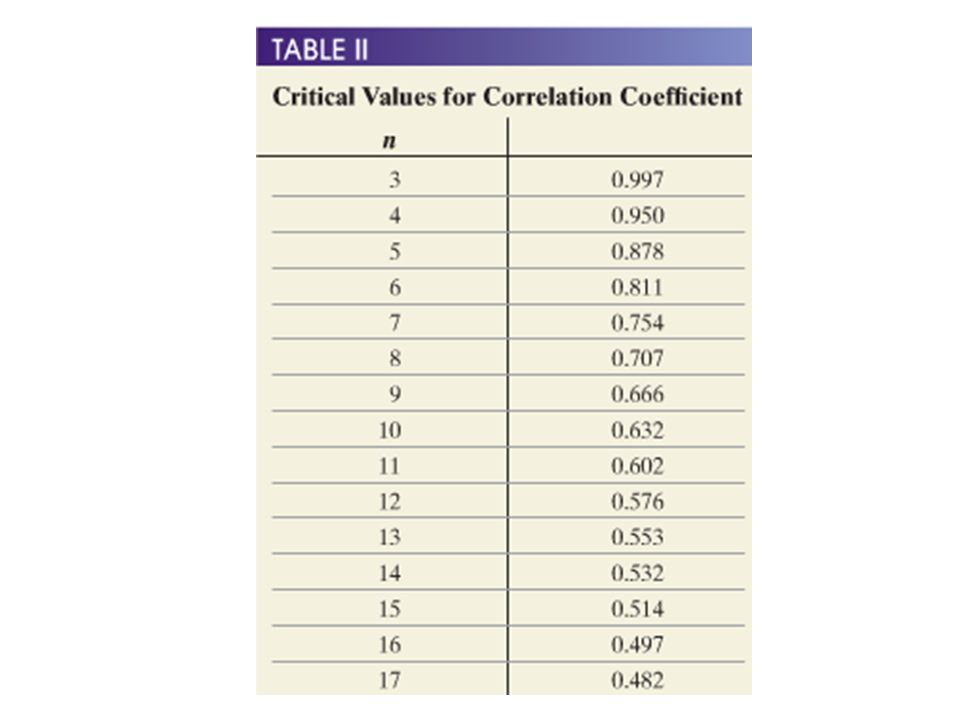
Testing for a Linear Relation 1.Determine the absolute value of the correlation coefficient |r| 2.Find the critical value (CV) in Table II from Appendix A for the given sample size 3.if |r| > CV : linear relation exists if |r| < CV : no linear relation exists
 in Table II from Appendix A for the given sample size 3.if |r| > CV : linear relation exists if |r| < CV : no linear relation exists")
15
4. Test to see if there is a linear relation between x and y XY 133 242 357 462 533

16
Correlation versus Causation Note: A linear correlation coefficient that implies a strong positive or negative association does not imply causation if it was computed using observational data

Similar presentations


 Reading on Quantitative Data Analysis: Baxter and Babbie, 2004, Chapter 12.>")
