Download presentation
Presentation is loading. Please wait.

1
Chapter Twelve

2
Figure 12.1 Relationship of Sampling Design to the Previous Chapters and the Marketing Research Process Focus of This Chapter Relationship to Previous Chapters Relationship to Marketing Process Sampling Design Process Nonprobability Sampling Techniques Probability Sampling Techniques Research Design Components (Chapter 3) Problem Definition Approach to Problem Field Work Data Preparation and Analysis Report Preparation and Presentation Research Design Figure 12.1 Relationship to the Previous Chapters & The Marketing Research Process
 Problem Definition Approach to Problem Field Work Data Preparation and Analysis Report Preparation and Presentation Research Design Figure 12.1 Relationship to the Previous Chapters & The Marketing Research Process")
3
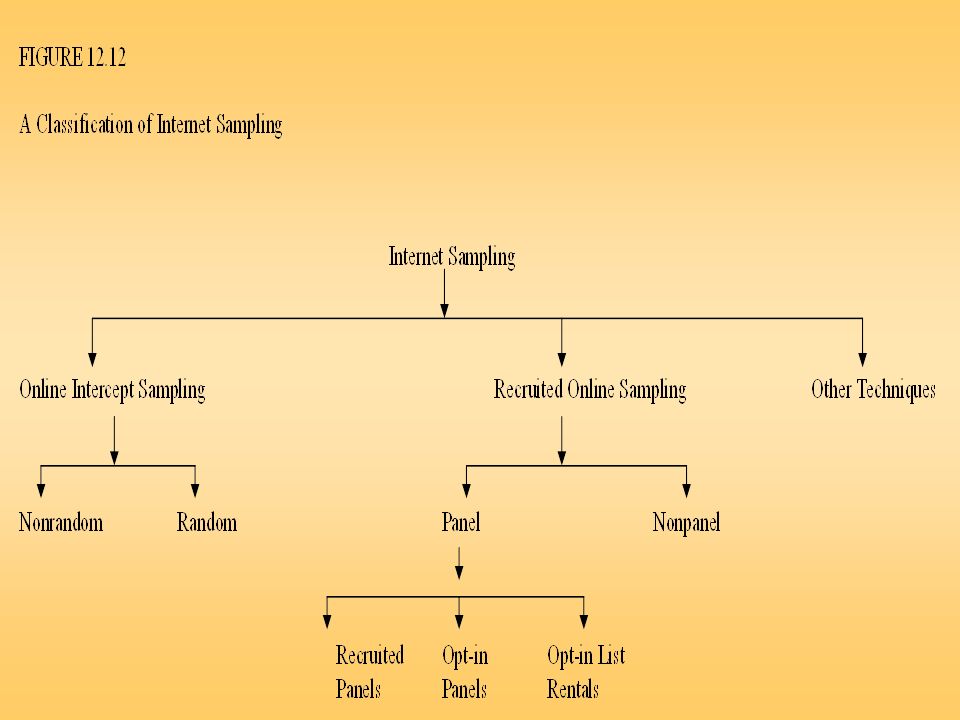
Application to Contemporary Issues TechnologyEthicsInternational Be a DM! Be an MR! Experiential Learning Opening Vignette What Would You Do? Sample of Census Sampling Design Process A Classification of Sampling Techniques Nonprobability Sampling Techniques Probability Sampling Techniques Figs 12.3- 12.5 Fig 12. 6 Figs 12.7- 12.8 Figs 12.8- 12.11 Table 12.4 Table 12.3 Table 12.2 Table 12.1 Internet Sampling Choosing Nonprobability vs. Probability Sampling Sample of Census Figs 12.12 Figure 12.2 Sampling Design Procedures: An Overview

4
Table 12.1 Sample Versus Census Table 12.1 Sample Versus Census

5
Define the Population Determine the Sampling Frame Select Sampling Technique(s) Determine the Sample Size Execute the Sampling Process Figure 12.3 Sampling Design Process
 Determine the Sample Size Execute the Sampling Process Figure 12.3 Sampling Design Process")
6
Define the Target Population The target population is the collection of elements or objects that possess the information sought by the researcher and about which inferences are to be made. The target population should be defined in terms of elements, sampling units, extent, and time. –An element is the object about which or from which the information is desired, e.g., the respondent. –A sampling unit is an element, or a unit containing the element, that is available for selection at some stage of the sampling process. –Extent refers to the geographical boundaries. –Time is the time period under consideration.

7
Define the Target Population Important qualitative factors in determining the sample size: –the importance of the decision –the nature of the research –the number of variables –the nature of the analysis –sample sizes used in similar studies –incidence rates –completion rates –resource constraints

8
Element: 18 year old females Sampling Unit: Households with 18 year old females Time Frame: Upcoming Summer Extent: Domestic United States Figure 12.4 Defining the Target Population

9
Figure 12.5 Sampling Frame Error Target Population: Single parent households in Chicago Sampling Frame Error Sampling Frame: List supplied by a commercial vendor Figure 12.5 Sampling Frame Error

10
Figure 12.6 Classification of Sampling Techniques Sampling Techniques Nonprobability Sampling Techniques Probability Sampling Techniques Figure 12.6 Classification of Sampling Techniques

11
Table 12.2 Sample Sizes Used in Marketing Research Studies

12
Figure 12.7 Nonprobability Sampling Techniques Nonprobability Sampling Techniques Convenience Sampling Judgmental Sampling Quota Sampling Snowball Sampling Figure 12.7 Non- probab ility Sampli ng Techni ques

13
Convenience Sampling Convenience sampling attempts to obtain a sample of convenient elements. Often, respondents are selected because they happen to be in the right place at the right time. –use of students and members of social organizations –mall intercept interviews without qualifying the respondents –department stores using charge account lists –“people on the street” interviews

14
Figure 12. 8 A Graphical Illustration of Non-Probability Sampling Techniques Convenience Sampling ABCDE 1611 16 21 2712 17 22 3813 18 23 4914 19 24 51015 20 25 Group D happens to assemble at a convenient time and place. So all the elements in this Group are selected. The resulting sample consists of elements 16, 17, 18, 19 and 20. Note, no elements are selected from group A, B, C and E.

15
Judgmental Sampling Judgmental sampling is a form of convenience sampling in which the population elements are selected based on the judgment of the researcher. –test markets –purchase engineers selected in industrial marketing research –bellwether precincts selected in voting behavior research –expert witnesses used in court

16
Figure 12.8 A Graphical Illustration of Non-Probability Sampling Techniques Judgmental Sampling ABCDE 16 11 1621 271217 22 3 813 1823 491419 24 5 10 152025 The researcher considers groups B, C and E to be typical and convenient. Within each of these groups one or two elements are selected based on typicality and convenience. The resulting sample consists of elements 8, 10, 11, 13, 22 and 24. Note, no elements are selected from groups A and D.

17
Quota Sampling Quota sampling may be viewed as two-stage restricted judgmental sampling. –The first stage consists of developing control categories, or quotas, of population elements. –In the second stage, sample elements are selected based on convenience or judgment. PopulationSample compositioncomposition Control CharacteristicPercentagePercentageNumber Sex Male4848480 Female5252520 ____________ 1001001000

18
ABCDE 1 6 111621 271217 22 3 8 13 1823 49141924 51015 20 25 A quota of one element from each group, A to E, is imposed. Within each group, one element is selected based on judgment or convenience. The resulting sample consists of elements 3, 6, 13, 20 and 22. Note, one element is selected from each column or group. Figure 12. 8 A Graphical Illustration of Non-Probability Sampling Techniques Quota Sampling

19
Snowball Sampling In snowball sampling, an initial group of respondents is selected, usually at random. –After being interviewed, these respondents are asked to identify others who belong to the target population of interest. –Subsequent respondents are selected based on the referrals.

20
Random Selection Referrals ABCDE 16111621 2 7 12 1722 38 1318 23 4 9 141924 510152025 Figure 12.8 A Graphical Illustration of Non-Probability Sampling Techniques Snowball Sampling Elements 2 and 9 are selected randomly from groups A and B. Element 2 refers elements 12 and 13. Element 9 refers element 18. The resulting sample consists of elements 2, 9, 12, 13, and 18. Note, no element from group E.

21
Figure 12.9 Probability Sampling Techniques Probability Sampling Techniques Simple Random Sampling Cluster Sampling Stratified Sampling Systematic Sampling Figure 12.8 Probability Sampling TechniquesFigure 12.8 Probability Sampling Techniques

22
Simple Random Sampling Each element in the population has a known and equal probability of selection. Each possible sample of a given size (n) has a known and equal probability of being the sample actually selected. This implies that every element is selected independently of every other element.
 has a known and equal probability of being the sample actually selected. This implies that every element is selected independently of every other element..")
23
ABCDE 1611 16 21 2 7 121722 3 8131823 4 9 1419 24 510152025 Select five random numbers from 1 to 25. The resulting sample consists of population elements 3, 7, 9, 16, and 24. Note, there is no element from Group C. Figure 12.10 A Graphical Illustration of Probability Sampling Techniques Simple Random Sampling

24
Systematic Sampling The sample is chosen by selecting a random starting point and then picking every ith element in succession from the sampling frame. The sampling interval, i, is determined by dividing the population size N by the sample size n and rounding to the nearest integer. When the ordering of the elements is related to the characteristic of interest, systematic sampling increases the representativeness of the sample. If the ordering of the elements produces a cyclical pattern, systematic sampling may decrease the representativeness of the sample. For example, there are 100,000 elements in the population and a sample of 1,000 is desired. In this case the sampling interval, i, is 100. A random number between 1 and 100 is selected. If, for example, this number is 23, the sample consists of elements 23, 123, 223, 323, 423, 523, and so on.

25
ABCDE 16111621 27121722 38131823 49141924 510152025 Figure 12.10 A Graphical Illustration of Probability Sampling Techniques Systematic Sampling Select a random number between 1 to 5, say 2. The resulting sample consists of population 2, (2+5=) 7, (2+5x2=) 12, (2+5x3=)17, and (2+5x4=) 22. Note, all the elements are selected from a single row.
 7, (2+5x2=) 12, (2+5x3=)17, and (2+5x4=) 22. Note, all the elements are selected from a single row..")
26
Stratified Sampling A two-step process in which the population is partitioned into subpopulations, or strata. The strata should be mutually exclusive and collectively exhaustive in that every population element should be assigned to one and only one stratum and no population elements should be omitted. Next, elements are selected from each stratum by a random procedure, usually SRS. A major objective of stratified sampling is to increase precision without increasing cost.

27
Stratified Sampling The elements within a stratum should be as homogeneous as possible, but the elements in different strata should be as heterogeneous as possible. The stratification variables should also be closely related to the characteristic of interest. Finally, the variables should decrease the cost of the stratification process by being easy to measure and apply. In proportionate stratified sampling, the size of the sample drawn from each stratum is proportionate to the relative size of that stratum in the total population. In disproportionate stratified sampling, the size of the sample from each stratum is proportionate to the relative size of that stratum and to the standard deviation of the distribution of the characteristic of interest among all the elements in that stratum.

28
ABCDE 161116 21 2 7 121722 38 13 1823 4 914 19 24 510152025 Figure 12.10 A Graphical Illustration of Probability Sampling Techniques Stratified Sampling Randomly select a number from 1 to 5 for each stratum, A to E. The resulting sample consists of population elements 4, 7, 13, 19 and 21. Note, one element is selected from each column.

29
Cluster Sampling The target population is first divided into mutually exclusive and collectively exhaustive subpopulations, or clusters. Then a random sample of clusters is selected, based on a probability sampling technique such as SRS. For each selected cluster, either all the elements are included in the sample (one-stage) or a sample of elements is drawn probabilistically (two-stage). Elements within a cluster should be as heterogeneous as possible, but clusters themselves should be as homogeneous as possible. Ideally, each cluster should be a small-scale representation of the population. In probability proportionate to size sampling, the clusters are sampled with probability proportional to size. In the second stage, the probability of selecting a sampling unit in a selected cluster varies inversely with the size of the cluster.
 or a sample of elements is drawn probabilistically (two-stage). Elements within a cluster should be as heterogeneous as possible, but clusters themselves should be as homogeneous as possible. Ideally, each cluster should be a small-scale representation of the population. In probability proportionate to size sampling, the clusters are sampled with probability proportional to size. In the second stage, the probability of selecting a sampling unit in a selected cluster varies inversely with the size of the cluster..")
30
ABCDE 161116 21 2 7 121722 3813 1823 49141924 51015 20 25 Figure 12.10 A Graphical Illustration of Probability Sampling Techniques Cluster Sampling (2-Stage) Randomly select 3 clusters, B, D and E. Within each cluster, randomly select one or two elements. The resulting sample consists of population elements 7, 18, 20, 21, and 23. Note, no elements are selected from clusters A and C.

31
Figure 12.11 Types of Cluster Sampling Divide Population into Cluster Randomly Sample Clusters One StageTwo-Stage Randomly Sample Elements from Each Selected Cluster Include All Elements from Each Selected Cluster Figure 12.9 Types of Cluster Sampling

33
Table 12.3 Strengths and Weaknesses of Basic Sampling TechniquesTable 12.3 Strengths and Weaknesses of Basic Sampling Techniques

34
TABLE 12.3 (cont.) Strengths and Weaknesses of Basic Sampling Techniques ________________________________________________________________ TechniqueStrengths Weaknesses ________________________________________________________________ SnowballCan estimate rareTime samplingcharacteristics consuming Probability Sampling Simple randomEasily understood,Difficult to sampling (SRS)results projectableconstruct; sampling frame, expensive, lower precision, no assurance of representative- ness
 Strengths and Weaknesses of Basic Sampling Techniques ________________________________________________________________ TechniqueStrengths Weaknesses ________________________________________________________________ SnowballCan estimate rareTime samplingcharacteristics consuming Probability Sampling Simple randomEasily understood,Difficult to sampling (SRS)results projectableconstruct; sampling frame, expensive, lower precision, no assurance of representative- ness")
35
Table 12.3 Strengths and Weaknesses of Basic Sampling Techniques (Cont.)Table 12.3 Strengths and Weaknesses of Basic Sampling Techniques (Cont.)
Table 12.3 Strengths and Weaknesses of Basic Sampling Techniques (Cont.)")
36
Table 12.4 Choosin g Non- probabil ity Versus Probabil ity Samplin g

Similar presentations