Download presentation
Presentation is loading. Please wait.

1
Do’s and Don’ts of Dairy Risk Management Dr. Marin Bozic Alltech Workshops October 23-24, 2013

2
A real problem…

3
But it hurts to leave money on the table…

4
Agenda for Today 1.Goals and Principles of Dairy Risk Management 2.Hedging with Futures and Options 3.Using LGM-Dairy 4.New Farm Bill Dairy Programs

5
Start with the end in mind. Retirement without debt? Prevent catastrophic losses? Gives me headaches, but necessary evil? Chase the highs, beat the market? Grow faster?

6
Hedge early, hedge often

10
A simple hedging program with puts Buy puts consistently, do not try to guess what the price will do next Never spend more than 50 cents on a put Let us evaluate three strategies: 1)Always buy puts for milk produced THREE months from now E.g. in January 2013 hedge April milk, in Februaryhedge May milk, etc. 2) Always buy puts for milk produced SEVEN months from now E.g. in January 2013 hedge August milk, in February hedge September milk, etc. 3) Always buy puts for milk produced ELEVEN months from now E.g. in January 2013 hedge November milk, in February hedge December milk, etc.
 Always buy puts for milk produced SEVEN months from now E.g. in January 2013 hedge August milk, in February hedge September milk, etc. 3) Always buy puts for milk produced ELEVEN months from now E.g. in January 2013 hedge November milk, in February hedge December milk, etc..")
11
A simple hedging program with puts Hedging Horizon What Can You Buy for 50 cents? (Option Strike) 1 month 5 cents below futures 3 months 64 cents below futures 5 months 1.08 below futures 7 months 1.44 below futures 9 months 1.74 below futures 11 months 2.08 below futures
 1 month 5 cents below futures 3 months 64 cents below futures 5 months 1.08 below futures 7 months 1.44 below futures 9 months 1.74 below futures 11 months 2.08 below futures.")
12
Hedging with Puts: 3-months Out

13
Hedging with Puts: 7-months Out

14
Hedging with Puts: 11-months Out

15
A simple hedging program with puts Hedging Horizon Number of Profitable Trades Net Profit/Loss 2007-2012 Return on Investment 2007-2012 1 month 16/74-0.14-41% 3 months 21/740.0613% 5 months 19/740.2146% 7 months 15/740.2452% 9 months 09/740.2657% 11 months 10/740.3373%

16
Lessons Learned? Either hedge consistently or not at all. Plan for hedging far ahead. When prices decline, they tend to stay low for a while. If you wait for too long, the opportunity to lock in good prices may be gone. You are likely to lose money on most of your trades. That’s OK. That does not mean that the market is full of crooks. It means that bad times come around infrequently, but when they do come, you will get back plentifully.

17
2006-2012 returns to at-the-money put options 1 month ahead: Cost: 0.19/bu Payout: 0.16/bu 3 months ahead: Cost: 0.68/bu Payout: 0.79 6 months ahead: Cost: 0.95/bu Payout: 1.33/bu 9 months ahead: Cost: 1.13/bu Payout: 1.59/bu

18
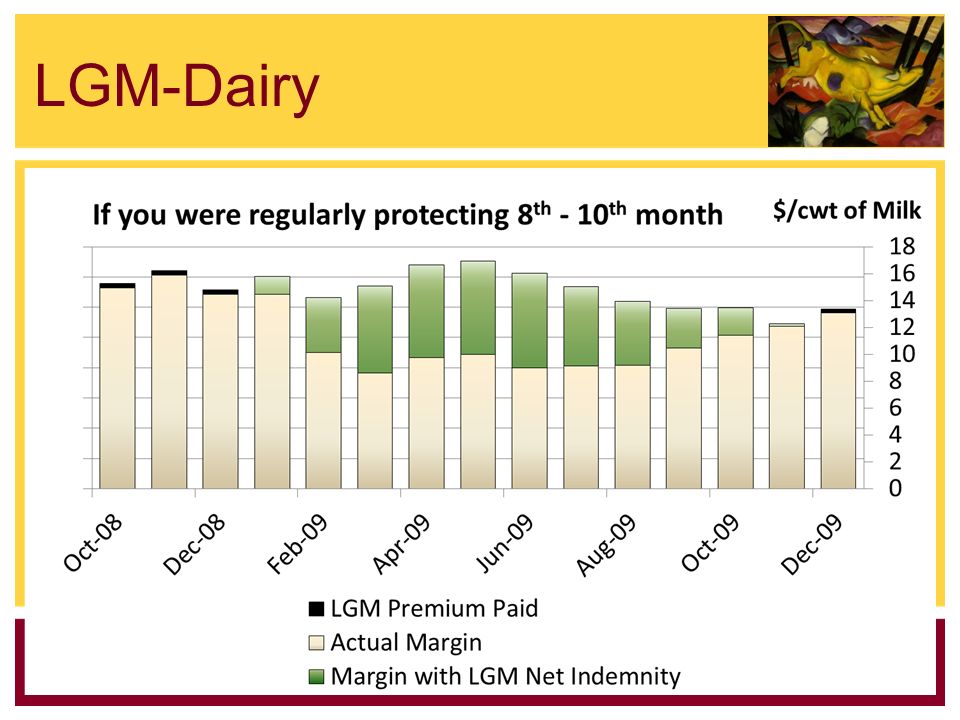
LGM-Dairy

20
Farm bill Two alternatives: Senate Bill No. 954 “Dairy Security Act” House Bill. 2642 “Goodlatte-Scott Amendment”

21
Farm bill Dairy Margin All-Milk (/cwt) - 1.0728 x Corn (/bu) - 0.0735 x Soybean meal (/ton) - 0.0137 x Alfalfa hay (/ton) Feed ration per cwt of milk: 30 pounds of shell corn, 106.4 pounds of corn silage, 14.7 pounds of soybean meal 27.4 lbs of alfalfa hay
 x Corn (/bu) x Soybean meal (/ton) x Alfalfa hay (/ton) Feed ration per cwt of milk: 30 pounds of shell corn, pounds of corn silage, 14.7 pounds of soybean meal 27.4 lbs of alfalfa hay")
22
Farm bill Dairy Margin Coverage Level SenateHouse <4mil4mil+<4mil4mil lbs+ 4.000.00 0.03 4.500.010.02 0.010.045 5.00 0.020.040.020.066 5.50 0.0350.100.0350.11 6.00 0.0450.150.0450.185 6.50 0.090.290.090.29 7.00 0.400.620.180.38 7.50 0.600.830.600.83 8.00 0.951.060.951.06

23
Subsidized Margin Insurance Official name: Dairy Producer Margin Protection Program (PDMPP) Two layers: Basic Margin Protection – No-cost protection at 4.00 margin Supplemental Margin Protection – Can buy up from 4.50 to 8.00 margin in 50 cents increments (called “Coverage Level”)
 Two layers: Basic Margin Protection – No-cost protection at 4.00 margin Supplemental Margin Protection – Can buy up from 4.50 to 8.00 margin in 50 cents increments (called Coverage Level )")
24
Subsidized Margin Insurance

28
Consecutive Two-Month Periods 2012 Two-month Average January7.57 February5.826.70 March4.94 April4.264.60 May3.41 June3.513.44 July2.74 August2.982.86 September5.51 October7.286.39 Calendar year is divided into consecutive two- month periods Average margin must be below the purchased coverage level in order for indemnities to be due. DPMPP: What triggers it exactly?

29
DPMPP: What is the payment rate? Consecutive Two-Month Average Jan – Feb6.72 Mar-Apr4.59 May-Jun3.44 Jul-Aug2.86 Sep-Oct5.90 Example: Larry subscribed for basic margin protection. For Jul-Aug, payment rate was $1.14 per cwt. Basic Margin Protection The difference between the actual margin and $4.00, except that, if the difference is more than $4.00, the Secretary shall use $4.00

30
DPMPP: What is the payment base? Consecutive Two-Month Average Jan – Feb6.72 Mar-Apr4.59 May-Jun3.44 Jul-Aug2.86 Sep-Oct5.90 Supplemental Margin Protection: The difference between coverage level and the greater of actual margin and $4.00. Example: Larry also subscribed for supplemental margin protection at $6.50 coverage level. For Jul- Aug, the payment rate on supplemental was $6.50- max($4.00, $2.86) = $2.50
 = $2.50.")
31
DPMPP: What is the payment base? Basic Production History -Highest annual milk marketings in any 1 of the 3 calendar years before program sign-up -Used in Basic Margin Protection Annual Production History: -Actual milk marketings of the participating dairy during the previous year -Used in Supplemental Margin Protection

32
Trigger: -Actual margins of $6.00 or less for each of the immediately preceding two months -Actual margin of $4.00 or less for the immediately preceding month Dairy Market Stabilization Program Month2012 January7.57 February5.82 March4.96 April4.26 May3.41 June3.51 July2.74 August2.98 September5.51 October7.28

33
Producer is not going to be paid for more than the greater of… –If margins were $5.00-$6.00: 98 percent of stabilization base 94 percent of the marketings of milk –If margins were $4.00-$5.00 97 percent of stabilization base 93 percent of the marketings of milk –If margins were less than $4.00 96 percent of stabilization base 92 percent of the marketings of milk DMSP – what is the “penalty”?

34
Let’s play a game… Imagine that it is January 15, 2008. Dairy Security Act has just become a law. You are the owner of ‘North Star Dairy’ a fictional large dairy operation in Minnesota that had grown to about 2000 cows at the end of 2012. You have made a decision to participate in the DPMPP/DMSP in 2008. Let’s see how did the program work for you over 2008-2012 period.

35
Please take a look at this device… (forget everything from 2008+)
")
36
North Star Dairy has been growing… Year Pounds shipped 2005 30 mil 2006 35 mil 2007 40 mil 2008 43 mil 2009 44 mil 2010 45 mil 2011 50 mil 2012 55 mil

37
Information as of January 2008…

39
Coverage Level Fees & Premiums Expected Indemnity DMSP Penalty Net Revenue $4.00 1,0007,51514,097-7,582 $4.50 6,27314,20114,097-6,169 $5.00 13,69224,62014,097-3,169 $5.50 28,97339,98914,097-3,081 $6.00 54,11262,27614,097-5,933 $6.50 79,58093,39314,097-283 $7.00 158,787135,56014,097-37,323 $7.50 215,503190,77214,097-38,828 $8.00 336,206260,14214,097-90,161

40
Actual Income Over Feed Cost Margin in 2008

41
This is how 2008 turned out for you… Coverage Level Fees & Premiums Realized Indemnity DMSP Penalty Realized Net Revenue $4.00 1,00000-1,000 $4.50 6,27300-6,273 $5.00 13,69200-13,692 $5.50 28,97300-28,973 $6.00 54,11200-54,112 $6.50 79,58000-79,580 $7.00 158,78700-158,787 $7.50 215,50300-215,503 $8.00 336,20600-336,206

42
Information as of January 2009…

44
Coverage Level Fees & Premiums Expected Indemnity DMSP Penalty Net Revenue $4.00 1,00078,471129,704-52,232 $4.50 6,661141,674129,7045,308 $5.00 14,623230,757129,70486,430 $5.50 31,067340,466129,704179,695 $6.00 58,120464,086129,704276,261 $6.50 85,527599,567129,704384,336 $7.00 170,009745,680129,704445,968 $7.50 230,758901,491129,704541,029 $8.00 360,0461,066,022129,704576,272

45
Actual Income Over Feed Cost Margin in 2009

46
This is how 2009 turned out for you… Coverage Level Fees & Premiums Realized Indemnity DMSP Penalty Realized Net Revenue $4.00 1,000145,191191,360-47,169 $4.50 6,661274,168191,36076,147 $5.00 14,623403,145191,360197,162 $5.50 31,067532,122191,360309,695 $6.00 58,120675,425191,360425,944 $6.50 85,527836,657191,360559,770 $7.00 170,009997,889191,360636,520 $7.50 230,7581,159,120191,360737,002 $8.00 360,0461,337,377191,360785,971

47
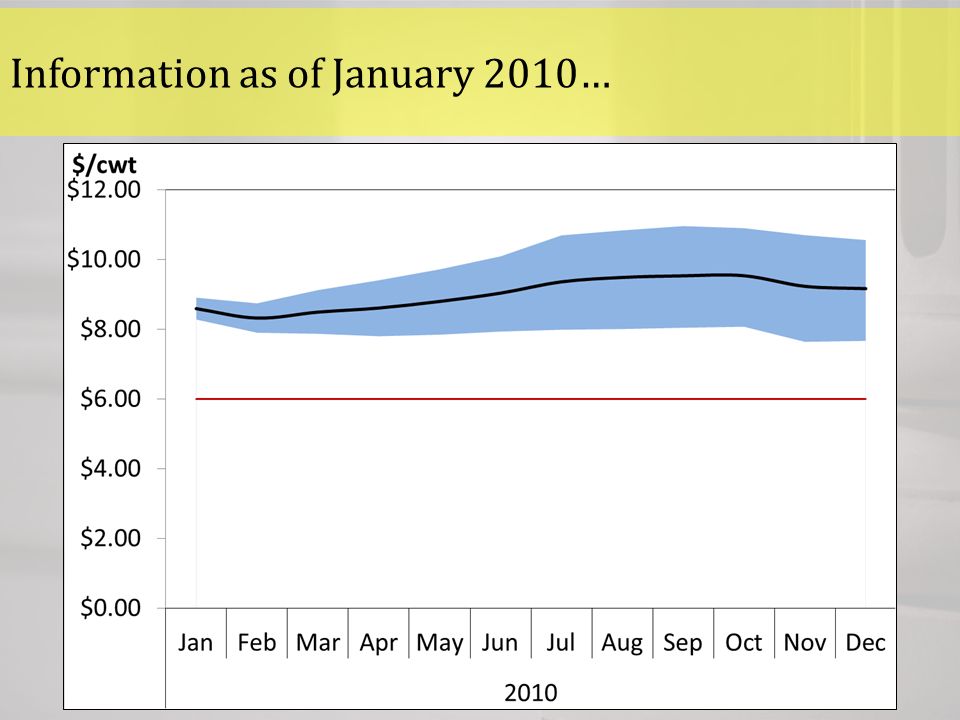
Information as of January 2010…

49
Coverage Level Fees & Premiums Expected Indemnity DMSP Penalty Net Revenue $4.00 1,0001951,453-2,258 $4.50 6,7636331,453-7,583 $5.00 14,8671,5111,453-14,809 $5.50 31,6163,2741,453-29,795 $6.00 59,1716,9321,453-53,691 $6.50 87,08613,7401,453-74,799 $7.00 172,95026,2491,453-148,153 $7.50 234,75747,8071,453-188,403 $8.00 366,29585,0341,453-282,714

50
Actual Income Over Feed Cost Margin in 2010

51
This is how 2010 turned out for you… Coverage Level Fees & Premiums Realized Indemnity DMSP Penalty Realized Net Revenue $4.00 1,00000-1,000 $4.50 6,76300-6,763 $5.00 14,86700-14,867 $5.50 31,61600-31,616 $6.00 59,17100-59,171 $6.50 87,08600-87,086 $7.00 172,95000-172,950 $7.50 234,75710,4420-224,314 $8.00 366,29558,0780-308,217

52
Information as of January 2011…

54
Coverage Level Fees & Premiums Expected Indemnity DMSP Penalty Net Revenue $4.00 1,00056,70875,364(19,656) $4.50 6,90986,06175,3643,788 $5.00 15,219125,35275,36434,769 $5.50 32,407177,18975,36469,418 $6.00 60,684245,89875,364109,850 $6.50 89,331338,08275,364173,387 $7.00 177,188458,39375,364205,841 $7.50 240,518601,84975,364285,967 $8.00 375,298761,75975,364311,097
 $4.50 6,90986,06175,3643,788 $ ,219125,35275,36434,769 $ ,407177,18975,36469,418 $ ,684245,89875,364109,850 $ ,331338,08275,364173,387 $ ,188458,39375,364205,841 $ ,518601,84975,364285,967 $ ,298761,75975,364311,097")
55
Actual Income Over Feed Cost Margin in 2011

56
This is how 2011 turned out for you… Coverage Level Fees & Premiums Realized Indemnity DMSP Penalty Realized Net Revenue $4.00 1,00000(1,000) $4.50 6,90900(6,909) $5.00 15,21900(15,219) $5.50 32,40700(32,407) $6.00 60,68400(60,684) $6.50 89,33100(89,331) $7.00 177,18800(177,188) $7.50 240,51800(240,518) $8.00 375,2989,8860(365,412)
 $4.50 6,90900(6,909) $ ,21900(15,219) $ ,40700(32,407) $ ,68400(60,684) $ ,33100(89,331) $ ,18800(177,188) $ ,51800(240,518) $ ,2989,8860(365,412)")
57
Information as of January 2012…

59
Coverage Level Fees & Premiums Expected Indemnity DMSP Penalty Net Revenue $4.00 1,00014,90843,764(29,856) $4.50 7,60528,32943,764(23,041) $5.00 16,88848,45543,764(12,197) $5.50 36,16377,63743,764(2,291) $6.00 67,871119,09443,7647,458 $6.50 99,996175,68943,76431,929 $7.00 197,312250,37243,7649,296 $7.50 267,875349,72543,76438,085 $8.00 418,049481,17643,76419,363
 $4.50 7,60528,32943,764(23,041) $ ,88848,45543,764(12,197) $ ,16377,63743,764(2,291) $ ,871119,09443,7647,458 $ ,996175,68943,76431,929 $ ,312250,37243,7649,296 $ ,875349,72543,76438,085 $ ,049481,17643,76419,363")
60
Actual Income Over Feed Cost Margin

61
This is how 2012 turned out for you… Coverage Level Fees & Premiums Realized Indemnity DMSP Penalty Realized Net Revenue $4.00 1,00090,541271,253-181,712 $4.50 7,605165,929271,253-112,929 $5.00 16,888271,141271,253-16,999 $5.50 36,163384,224271,25376,808 $6.00 67,871497,307271,253158,183 $6.50 99,996610,390271,253239,141 $7.00 197,312774,434271,253305,870 $7.50 267,875962,905271,253423,777 $8.00 418,0491,178,465271,253489,163

62
Historical and Forecasted Income Over Feed Costs Margins Forecasted IOFC Margins for 2014 are higher than 75% of historical IOFC margins since 2000. Source: USDA, CME Group, Own Forecasting Model Developed together with John Newton, the Ohio State University

63
U.S. All-Milk Price 2014 Outlook (80% Confidence Interval) Source: CME Group, Own Forecasting Model Developed together with John Newton, the Ohio State University
 Source: CME Group, Own Forecasting Model Developed together with John Newton, the Ohio State University.")
64
Do’s and Don’t‘s of Dairy Risk Management Alltech Workshops October 23-24, 2013 Dr. Marin Bozic mbozic@umn.edu Department of Applied Economics University of Minnesota-Twin Cities 317c Ruttan Hall 1994 Buford Avenue St Paul, MN 55108 Acknowledgements: Fanda Yang, PhD Student UMN Lou Kuhlmann, Advance Trading, Inc. John Newton, PhD Student, OSU

Similar presentations