Download presentation
Presentation is loading. Please wait.

1
Urban land use models predict the internal structure of cities. The models are quite different based on cities that are planned, those that are sprawling and more haphazard and also based on human behaviour.

3
In most cities land is zoned according to its present or potential use. Typical categories are: Agricultural Residential Industrial Commercial Open space (Recreational such as parks) Administrative (Town hall for example) Public (library, School for example)
 Administrative (Town hall for example) Public (library, School for example).")
4
The structure of a city is determined by its land use. Land use is determined by price of the land (see notes on Bid Rent and the Core-Frame Model) Patterns in residential land use is governed by price, social status, culture, physical landscape, aesthetics, access to services, push and pull factors.
 Patterns in residential land use is governed by price, social status, culture, physical landscape, aesthetics, access to services, push and pull factors..")
5
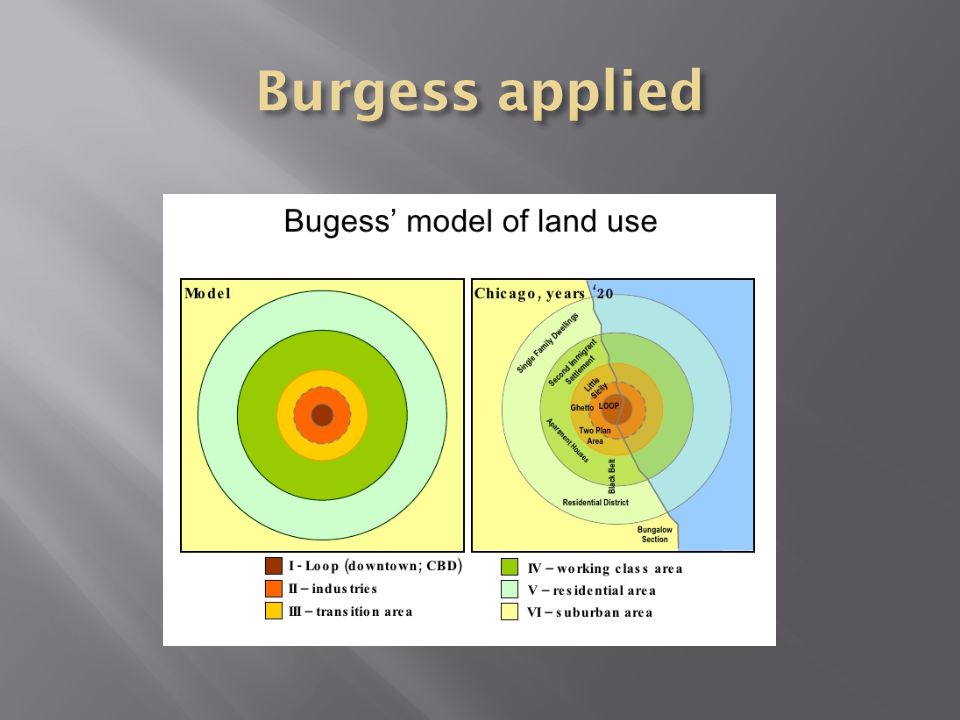
CBD Low Class Residential Middle Class Residential High Class Residential In the 1920’s Burgess, an American geographer, studied the spatial relationships of land usage in the city of Chicago. He found that different land uses tended to group in concentric rings around the city centre or Central Business District. Inner City

7
The Burgess Model can be applied to some cities European and American cities tend to have their oldest buildings in the centre and their newer ones at the fringe Pre war buildings and post war building can be deduced in parts, perhaps not full or equally sized-rings

8
Burgess carried out his research nearly 100 years ago. Patterns of land use in MEDC cities have changed. For example industries have moved to suburbs or green field sites. Cities in LEDC’s were never structured as Burgess suggested since poorer people lived in shanties on the outskirts of the city. Urban sprawl has tended to create multiple centres that “attract” within urban areas.

9
Street patterns can be useful on maps to illustrate the age of residential areas Straight-line streets or linear ones usually contain terraced housing Streets with curvature with dead-end cul-de- sac designs are much more modern. A map with many linear streets in the centre of city and many cul-de-sac styled streets near the fringe might suggest the city conforms quite well to the Burgess Model

10
Hoyt’s ideas varied from the Burgess model in that it allowed for urban development along major transport routes such as rail lines and arterial roads. Such development allowed some zones to expand further out and more rapidly. http://en.wikipedia.org/wiki/File:Hoyt_model.svg Source by ‘Cieran 91’ Wikipedia Project

11
Hoyt’s land use model was the first to take into account transport networks. Since transport routes tend to run along lower ground, industries prefer to locate along them for ease of access and for the flat land to expand on. Higher class residential homes locate on higher ground. Working Class houses are located near the industries and arterial routes. Hoyt said that land use zones occur in sectors.

12
http://en.wikipedia.org/wiki/File:Ulman2.png Source ‘SuzanneKn’ Wikipedia Project

13
Ullman and Harris developed the multiple nuclei at a time when suburbanisation was beginning to occur in MEDC’s. The zones or sectors are arranged as a patchwork. The patchwork occurs because as the suburbs expand secondary business districts arise and compete with the main CBD. The secondary CBD’s occur due to the location of major shopping centres for example.

14
Sector A Sector B 2 3 4 Each sixth of the “wheel” is a sector of a particular land use such as high class residential or industry. Each sector contains older housing towards the CBD (terraces at 2) and newest post 1945 at 4 near the fringe. Commuter settlements occur at 5. 5
 and newest post 1945 at 4 near the fringe. Commuter settlements occur at")
15
At a similar time to the America (Ullman and Harris) model, Mann produced a model that better fitted UK cities that were also rapidly changing due to suburbanisation. Old terraced houses still occupied city centers (even with declining industry). Progressively younger-aged property occurred towards the fringe. Commuter settlements were beginning to emerge short distances from the rural-urban fringe.
. Progressively younger-aged property occurred towards the fringe. Commuter settlements were beginning to emerge short distances from the rural-urban fringe..")
16
LEDC CBD-FRINGEMEDC CITY TO FRINGE Central CBD High Density Housing and Affluent Communities Housing with basic services Favela styled housing, no amenties, illegal dwellings Central CBD High density apartments, blocks of flats, Older style terraced homes Pre-war and post war semi detached Modern Detached (affluent) housing on estates or as suburbia
 housing on estates or as suburbia")
17
A typical land use arrangement might look like this Favelas Affluent Periferea Industrial

22
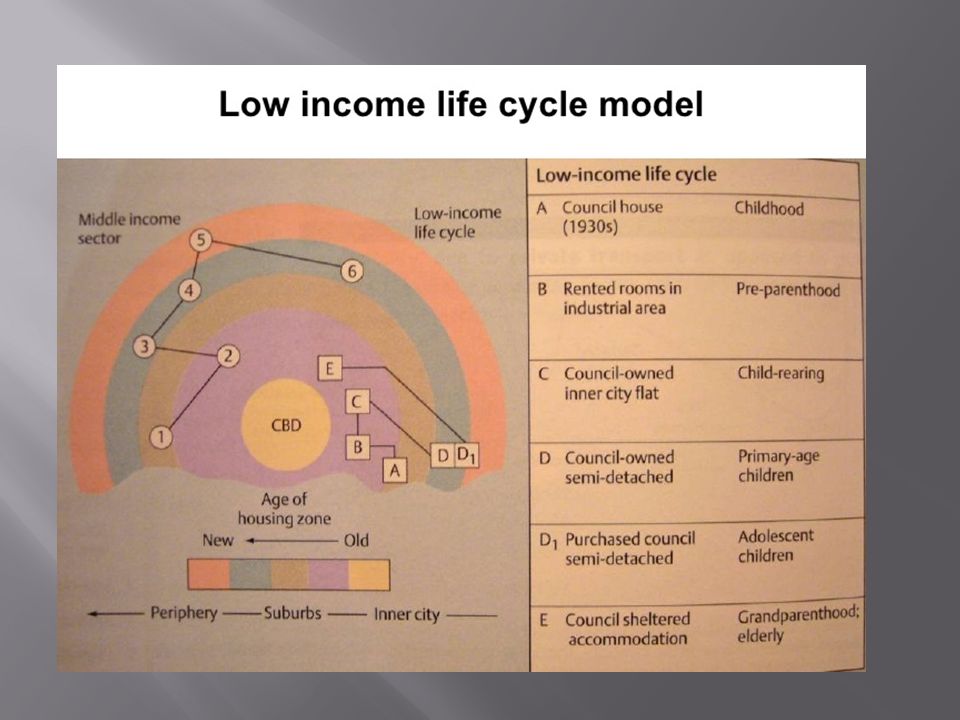
Family Life Cycle Model: a model which is based on the movements of people within a city seeking a better home as their personal circumstances (both financial and social) change over time.
 change over time.")
26
Each of the models contain elements that can be applied to many world cities. At street level the pattern of land use is complex and all cities have unique factors that combine to produce the emergence of particular sectors and zones. Globalisation, and the emergence of sprawling world cities means that immigrants strongly influence the socio-economic structures of many cities.

27
Distance from the city centre has an influence on the level of deprivation, and therefore subsequent quality of the urban environment that may be observed.

28
1. What are some criticisms of Burgess’ model? 2. According to Hoyt, apart from the CBD, what other area attracts the highest rent and why? 3. To what extent does the multiple nuclei model reflect suburbanised MEDC’s.

29
Use Google Earth to zoom in on a segment of a city. Take screen shots of the city and use it to build up evidence for each of the urban models in this presentation. Alternatively use street maps or directories of your city and identify buildings, street patterns that might reveal the land use. Produce a rough sketch of the main zones of land use for your city.

Similar presentations


 in 1939 Studied 64 widely distributed American cities Publication:>")


 Metropolitan area: Central city + Counties that commuters come from.>")


