Download presentation
Presentation is loading. Please wait.

1
Topics about reaction kinetics
Rate of reaction Order of reaction Half-life Reaction progress Activation energy Reaction mechanism

2
Chapter 13, Unnumbered Figure, Page 498

3
Figure 13.1 Reactant and Product Concentrations as a Function of Time

4
H2O2(aq) + 3 I–(aq) + 2 H+(aq) → I3(aq) + 2 H2O(l)
Example 13.1 Expressing Reaction Rates Consider the balanced chemical equation: H2O2(aq) + 3 I–(aq) + 2 H+(aq) → I3(aq) + 2 H2O(l) In the first 10.0 seconds of the reaction, the concentration of I– drops from M to M. (a) Calculate the average rate of this reaction in this time interval. (b) Predict the rate of change in the concentration of H+ (that is, [H+]/t) during this time interval. – SOLUTION (a) Use Equation 13.5 to calculate the average rate of the reaction. (b) Use Equation 13.5 again to determine the relationship between the rate of the reaction and [H+]/t. After solving for [H+]/t, substitute the calculated rate from part (a) and calculate [H+]/t.
 + 3 I–(aq) + 2 H+(aq) → I3(aq) + 2 H2O(l) In the first 10.0 seconds of the reaction, the concentration of I– drops from M to M. (a) Calculate the average rate of this reaction in this time interval. (b) Predict the rate of change in the concentration of H+ (that is, [H+]/t) during this time interval. – SOLUTION. (a) Use Equation 13.5 to calculate the average rate of. the reaction. (b) Use Equation 13.5 again to determine the. relationship between the rate of the reaction and. [H+]/t. After solving for [H+]/t, substitute. the calculated rate from part (a) and calculate. [H+]/t.")
5
Example 13.1 Expressing Reaction Rates
Continued For Practice 13.1 For the above reaction, predict the rate of change in the concentration of H2O2 ([H2O2]/t) and I3 ([I3]/t) during this time interval. –
 and I3 ([I3]/t) during this time interval. –")
6
Figure 13.1 Reactant and Product Concentrations as a Function of Time

7
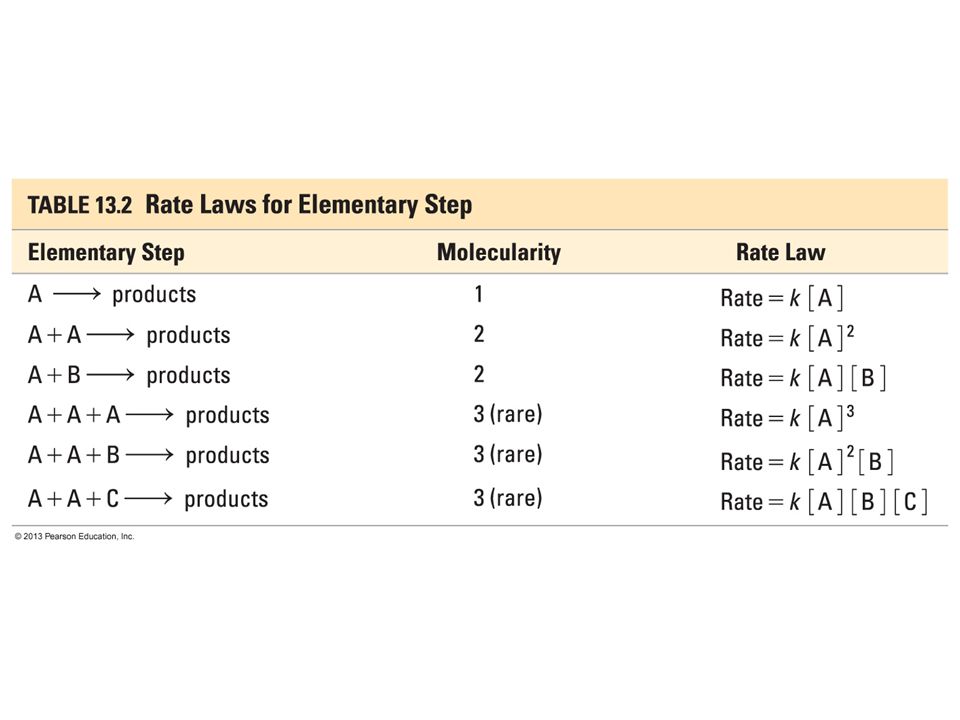
Chapter 13, Unnumbered Table, Page 499

8
Thermodynamics of kinetics
Figure 13.9 The Activation Energy Barrier

9
Figure 13.2 Reactant Concentration as a Function of Time for Different Reaction Orders

10
Figure 13.3 Reaction Rate as a Function of Reactant Concentration for Different Reaction Orders

11
Figure 13.4 Sublimation

12
Chapter 13, Unnumbered Table 1, Page 504

13
Chapter 13, Unnumbered Table 2, Page 504

14
Chapter 13, Unnumbered Figure, Page 505

15
Chapter 13, Unnumbered Figure A, Page 505

16
Chapter 13, Unnumbered Figure B, Page 505

17
Chapter 13, Unnumbered Figure C, Page 505

18
Figure 13.5 First-Order Integrated Rate Law

19
Chapter 13, Unnumbered Figure 1, Page 507

20
Chapter 13, Unnumbered Figure 2, Page 507

21
Figure 13.6 Second-Order Integrated Rate Law

22
Figure 13.7 Zero-Order Integrated Rate Law

23
Chapter 13, Unnumbered Figure, Page 509

24
Chapter 13, Unnumbered Figure, Page 510

25
Example 13.4 The First-Order Integrated Rate Law: Determining the
Concentration of a Reactant at a Given Time In Example 13.3, we learned that the decomposition of SO2Cl2 (under the given reaction conditions) is first order and has a rate constant of –4 s–1. If the reaction is carried out at the same temperature, and the initial concentration of SO2Cl2 is M, what is the SO2Cl2 concentration after 865 s? SOLUTION SORT You are given the rate constant of a first-order reaction and the initial concentration of the reactant. You are asked to find the concentration at 865 seconds. STRATEGIZE Use the first-order integrated rate law to determine the information you are asked to find from the given information. SOLVE Substitute the rate constant, the initial concentration, and the time into the integrated rate law. Solve the integrated rate law for the concentration of [SOCl2]t. GIVEN k = –4 s–1 [SO2Cl2]0 = M FIND [SO2Cl2] at t = 865 s EQUATION ln [A]t = –kt + ln [A]0 SOLUTION
 is first order and has a rate constant of –4 s–1. If the reaction is carried out at the same temperature, and the initial concentration of SO2Cl2 is M, what is the SO2Cl2 concentration after 865 s SOLUTION. SORT You are given the rate constant of a first-order reaction and the initial concentration of the reactant. You are asked to find the concentration at 865 seconds. STRATEGIZE Use the first-order integrated rate law to determine the information you are asked to find from the given information. SOLVE Substitute the rate constant, the initial concentration, and the time into the integrated rate law. Solve the integrated rate law for the concentration of [SOCl2]t. GIVEN k = –4 s–1. [SO2Cl2]0 = M. FIND [SO2Cl2] at t = 865 s. EQUATION ln [A]t = –kt + ln [A]0. SOLUTION.")
26
Example 13.4 The First-Order Integrated Rate Law: Determining the
Concentration of a Reactant at a Given Time Continued SOLUTION CHECK The concentration is smaller than the original concentration as expected. If the concentration were larger than the initial concentration, this would indicate a mistake in the signs of one of the quantities on the right-hand side of the equation. For Practice 13.4 Cyclopropane rearranges to form propene in the gas phase according to the reaction: The reaction is first order in cyclopropane and has a measured rate constant of –5 s–1 at 720 K. If the initial cyclopropane concentration is M, what is the cyclopropane concentration after minutes?

27
Example 13.5 The Second-Order Integrated Rate Law: Using Graphical
Analysis of Reaction Data Consider the equation for the decomposition of NO2. NO2(g) → NO(g) + O(g) The concentration of NO2 is monitored at a fixed temperature as a function of time during the decomposition reaction and the data tabulated in the margin at the top right of the next page. Show by graphical analysis that the reaction is not first order and that it is second order. Determine the rate constant for the reaction. SOLUTION In order to show that the reaction is not first order, prepare a graph of ln [NO2] versus time.
 → NO(g) + O(g) The concentration of NO2 is monitored at a fixed temperature as a function of time during the decomposition reaction and the data tabulated in the margin at the top right of the next page. Show by graphical analysis that the reaction is not first order and that it is second order. Determine the rate constant for the reaction. SOLUTION. In order to show that the reaction is not first order, prepare a graph of ln [NO2] versus time.")
28
Example 13.5 The Second-Order Integrated Rate Law: Using Graphical
Analysis of Reaction Data Continued SOLUTION The plot is not linear (the straight line does not fit the data points), confirming that the reaction is not first order. In order to show that the reaction is second order, prepare a graph of 1/ [NO2] versus time. This graph is linear (the data points fit well to a straight line), confirming that the reaction is indeed second order. To obtain the rate constant, determine the slope of the best fitting line. The slope is M–1 • s–1; therefore, the rate constant is 0.255 M–1 • s–1.
, confirming that the. reaction is not first order. In order to show that the reaction is second order, prepare a. graph of 1/ [NO2] versus time. This graph is linear (the data points fit well to a straight line), confirming that the reaction is indeed second order. To obtain the rate constant, determine the slope of. the best fitting line. The slope is M–1 • s–1; therefore, the rate constant is M–1 • s–1.")
29
Figure 13.8 Half-Life: Concentration versus Time for a First-Order Reaction

31
Example 13.6 Half-Life SOLUTION
Molecular iodine dissociates at 625 K with a first-order rate constant of s–1. What is the half-life of this reaction? SOLUTION Since the reaction is first order, the half-life is given by Equation Substitute the value of k into the expression and calculate t1/2. For Practice 13.6 A first-order reaction has a half-life of 26.4 seconds. How long will it take for the concentration of the reactant in the reaction to fall to one-eighth of its initial value?

32
Figure 13.10 The Activated Complex

33
Chapter 13, Unnumbered Figure, Page 512

34
Chapter 13, Unnumbered Figure, Page 513

35
Chapter 13, Unnumbered Figure 1, Page 514

36
Chapter 13, Unnumbered Figure 2, Page 514

37
Example 13.7 Using an Arrhenius Plot to Determine Kinetic Parameters
The decomposition of ozone is important to many atmospheric reactions: O3(g) → O2(g) + O(g) A study of the kinetics of the reaction resulted in the following data: Determine the value of the frequency factor and activation energy for the reaction. SOLUTION To find the frequency factor and activation energy, prepare a graph of the natural log of the rate constant (ln k ) versus the inverse of the temperature (1/T).
 → O2(g) + O(g) A study of the kinetics of the reaction resulted in the following data: Determine the value of the frequency factor and activation energy for the reaction. SOLUTION. To find the frequency factor and activation energy, prepare a graph of the natural log of the rate constant (ln k ) versus the inverse of the temperature (1/T).")
38
Example 13.7 Using an Arrhenius Plot to Determine Kinetic Parameters
Continued SOLUTION The plot is linear, as expected for Arrhenius behavior. The best fitting line has a slope of – K and a y-intercept of Calculate the activation energy from the slope by setting the slope equal to –Ea/R and solving for Ea:

39
Example 13.7 Using an Arrhenius Plot to Determine Kinetic Parameters
Continued SOLUTION Calculate the frequency factor ( A ) by setting the intercept equal to ln A. 26.8 = ln A A = e26.8 = Since the rate constants were measured in units of M–1 • s–1, the frequency factor is in the same units. Consequently, we can conclude that the reaction has an activation energy of 93.1 kJ/mol and a frequency factor of M–1 • s–1. For Practice 13.7 For the decomposition of ozone reaction in Example 13.7, use the results of the Arrhenius analysis to predict the rate constant at 298 K.
 by setting the intercept equal to ln A = ln A. A = e26.8. = Since the rate constants were measured in units of M–1 • s–1, the frequency factor is in the same units. Consequently, we can conclude that the reaction has an activation energy of 93.1 kJ/mol and a frequency factor of M–1 • s–1. For Practice For the decomposition of ozone reaction in Example 13.7, use the results of the Arrhenius analysis to predict the rate constant at 298 K.")
40
Figure 13.11 Thermal Energy Distribution

41
Chapter 13, Unnumbered Figure, Page 516

42
Figure 13.12 The Collision Model

43
Chapter 13, Unnumbered Figure 1, Page 517

44
Chapter 13, Unnumbered Figure 2, Page 517

45
Chapter 13, Unnumbered Figure 3, Page 517

47
Figure 13.13 Energy Diagram for a Two-Step Mechanism

48
Figure 13.14 Catalyzed and Uncatalyzed Decomposition of Ozone

49
Example 13.9 Reaction Mechanisms
Ozone naturally decomposes to oxygen by the reaction: 2 O3(g) → 3 O2(g) The experimentally observed rate law for this reaction is: Rate = k[O3]2[O2]–1 Show that the following proposed mechanism is consistent with the experimentally observed rate law. SOLUTION To determine whether the mechanism is valid, you must first determine whether the steps sum to the overall reaction. Since the steps do indeed sum to the overall reaction, the first condition is met. The second condition is that the rate law predicted by the mechanism must be consistent with the experimentally observed rate law. Since the second step is rate limiting, write the rate law based on the second step. Rate = k2[O3][O]
 → 3 O2(g) The experimentally observed rate law for this reaction is: Rate = k[O3]2[O2]–1. Show that the following proposed mechanism is consistent with the experimentally observed rate law. SOLUTION. To determine whether the mechanism is valid, you must first determine whether the steps sum to the overall reaction. Since the steps do indeed sum to the overall reaction, the first condition is met. The second condition is that the rate law predicted by the mechanism must be consistent with the experimentally observed rate law. Since the second step is rate limiting, write the rate law based on the second step. Rate = k2[O3][O]")
50
Example 13.9 Reaction Mechanisms
Continued SOLUTION Because the rate law contains an intermediate (O), you must express the concentration of the intermediate in terms of the concentrations of the reactants of the overall reaction. To do this, set the rates of the forward reaction and the reverse reaction of the first step equal to each other. Solve the expression from the previous step for [O], the concentration of the intermediate. Finally, substitute [O] into the rate law predicted by the slow step. CHECK Since the two steps in the proposed mechanism sum to the overall reaction, and since the rate law obtained from the proposed mechanism is consistent with the experimentally observed rate law, the proposed mechanism is valid. The –1 reaction order with respect to [O2] indicates that the rate slows down as the concentration of oxygen increases—oxygen inhibits, or slows down, the reaction.
, you must express the concentration of the intermediate in terms of the concentrations of the reactants of the overall reaction. To do this, set the rates of the forward reaction and the reverse reaction of the first step equal to each other. Solve the expression from the previous step for [O], the concentration of the intermediate. Finally, substitute [O] into the rate law predicted by the slow step. CHECK Since the two steps in the proposed mechanism sum to the overall reaction, and since the rate law obtained from the proposed mechanism is consistent with the experimentally observed rate law, the proposed mechanism is valid. The –1 reaction order with respect to [O2] indicates that the rate slows down as the concentration of oxygen increases—oxygen inhibits, or slows down, the reaction.")
51
Example 13.9 Reaction Mechanisms
Continued For Practice 13.9 Predict the overall reaction and rate law that would result from the following two-step mechanism. 2 A → A Slow A2 + B → A2B Fast

52
Figure 13.15 Homogeneous and Heterogeneous Catalysis

53
Chapter 13, Unnumbered Figure, Page 525

54
Figure 13.16 Enzyme–Substrate Binding

55
Chapter 13, Unnumbered Figure, Page 528

56
Chapter 13, Unnumbered Figure 1, Page 529

57
Chapter 13, Unnumbered Figure 2, Page 529

58
Chapter 13, Unnumbered Figure 3, Page 529

59
Chapter 13, Unnumbered Figure, Page 531

60
Chapter 13, Unnumbered Figure 1, Page 534

61
Chapter 13, Unnumbered Figure 2, Page 534

62
Chapter 13, Unnumbered Figure 1, Page 536

63
Chapter 13, Unnumbered Figure 1A, Page 536

64
Chapter 13, Unnumbered Figure 1B, Page 536

65
Chapter 13, Unnumbered Figure 1C, Page 536

66
Chapter 13, Unnumbered Figure 2, Page 536

Similar presentations


>")


 + 3 I - (aq) + 2H + (aq) I 3 - (aq) + H 2 O (l)>")


![Reaction order The rate law can be written in a generalized form: v = k [A] a [B] b …. where a is the order of the reaction with respect to the species.](/21/6261067/big_thumb.jpg "Reaction order The rate law can be written in a generalized form: v = k [A] a [B] b …. where a is the order of the reaction with respect to the species.>")


 Assignment 3 up now and will be due Mon., Feb. 05 Assignment 4.>")