Download presentation
Presentation is loading. Please wait.

1
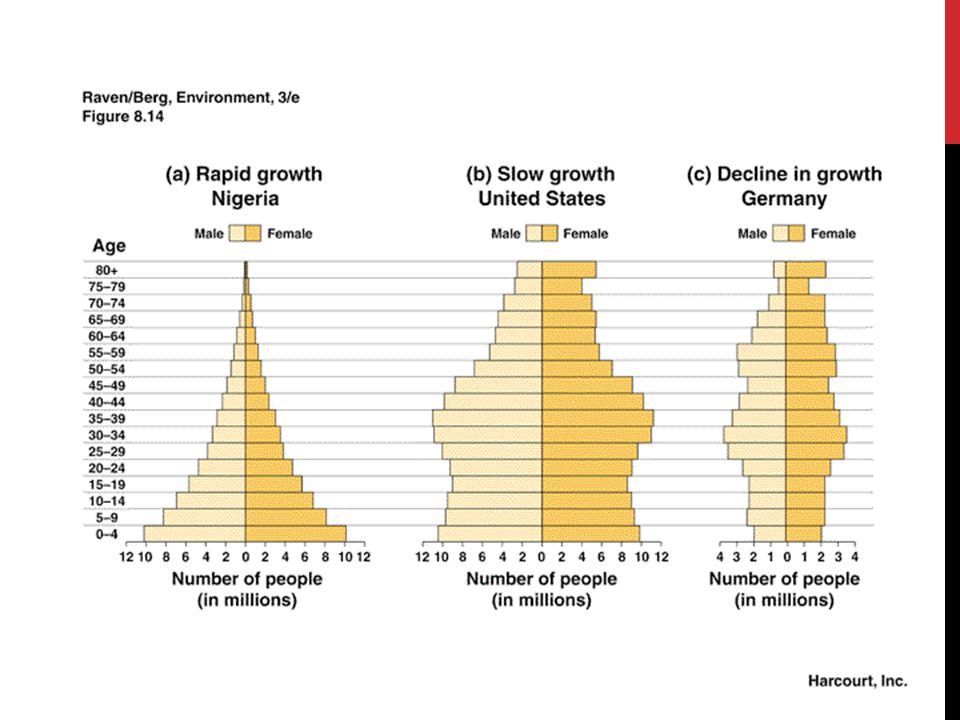
WARM-UP 3/21: Describe the 4 stages to Human Population Growth by completing the table. StageBirth Rate (Increasing/ Declining/ No change) Death Rate (Increasing/ Declining/No change) Growth Rate ( G= +, -,0) Society (Historic, Industrial, Developing, Post Industrial) I II III IV
 Death Rate (Increasing/ Declining/No change) Growth Rate ( G= +, -,0) Society (Historic, Industrial, Developing, Post Industrial) I II III IV.")
2
KEY: Describe the 4 stages to Human Population Growth by completing the table. StageBirth Rate (Increasing/ Declining/ No change) Death Rate (Increasing/ Declining/ No change) Growth Rate ( G= +, -,0) Society (Historic, Industrial, Developing, Post Industrial) I Same G=0Historic II SameDeclineG=+Developing III Decline G=0Industrial IV Big DeclineDeclineG=-Post Industrial
 Death Rate (Increasing/ Declining/ No change) Growth Rate ( G= +, -,0) Society (Historic, Industrial, Developing, Post Industrial) I Same G=0Historic II SameDeclineG=+Developing III Decline G=0Industrial IV Big DeclineDeclineG=-Post Industrial.")
3
19.1 UNDERSTANDING POPULATIONS

4
1. POPULATION PROPERTIES Size (often hard to measure) Density– amount of population per unit of area (population crowding) # of individuals = population density area (units 2 ) Dispersion – spatial organization of the population
 Density– amount of population per unit of area (population crowding) # of individuals = population density area (units 2 ) Dispersion – spatial organization of the population.")
5
1. POPULATION PROPERTIES Dispersion – spatial organization of the population Clumped – population is clustered together, usually around resources or from social behavior ex/ school of fish

6
clumped

7
1. POPULATION PROPERTIES Dispersion – spatial organization of the population Uniform – the population is evenly dispersed from each other usually from social interactions ex/ bird nesting sites or solitary predators

8
uniform

9
1. POPULATION PROPERTIES Dispersion – spatial organization of the population Random – the population is randomly scattered throughout the area ex/ trees in a forest with seeds dispersed by wind or animals

10
random

11
2. POPULATION DYNAMICS Age Structure i.the number of individuals of different ages within the population ii.different age groups may have different abilities such as birth/death rates

13
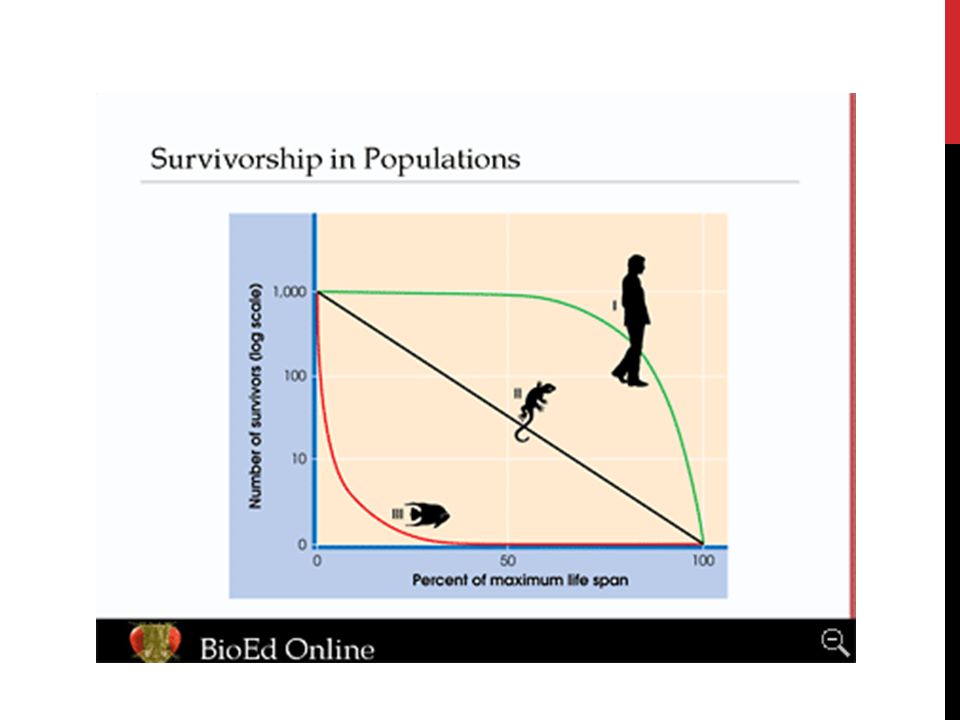
2. POPULATION DYNAMICS Survivorship Curve probability of individuals surviving to a certain age I – Low birth rate, low infant mortality, survives to old age (Humans & large mammals)
.")
14
2. POPULATION DYNAMICS Survivorship Curve probability of individuals surviving to a certain age I – Low birth rate, low infant mortality, survives to old age (Humans & large mammals)
.")
15
2. POPULATION DYNAMICS II – Survivorship rate equal at all ages (Birds & reptiles)
")
16
2. POPULATION DYNAMICS II – Survivorship rate equal at all ages (Birds & reptiles)
")
17
2. POPULATION DYNAMICS III – High birth rate, high infant mortality rate (Fish, Insects, Plants)
")
18
2. POPULATION DYNAMICS III – High birth rate, high infant mortality rate (Fish, Insects, Plants)
")
20
HOMEWORK Due Monday Population Growth & Patterns WS Human Population Growth WS Exam Wednesday 3/26. Math will be on the Test! You may use a calculator but not your cell phone. So Bring a CALCULATOR Intervention Monday Afternoon 2:45- 3:30 pm and Tuesday Morning 6:50 – 7:35 am.

Similar presentations


 Population Size (usually estimated)>")


 Density– amount of population per unit of area (population crowding) #>")
 Understanding Populations Population: group of 1 species living in the same place at 1 time 3 characteristics: –Size –Density.>")


>")
