Download presentation
Presentation is loading. Please wait.

1
TLS MODELLING OF ANISOTROPY IN MACROMOLECULAR REFINEMENT Martyn Winn CCP4, Daresbury Laboratory, U.K. York, April 11th 2002

2
Aims Mean square atomic displacements (static and dynamic) are an important part of model of protein. Atomic displacements are likely anisotropic, but rarely have luxury of refining individual anisotropic Us. Instead isotropic Bs. Intermediate descriptions??

3
Contributions to atomic U U = U crystal + U TLS + U internal + U atom U crystal : overall anisotropic scale factor w.r.t. crystal axes. U TLS : rigid body displacements e.g. of molecules, domains, secondary structure elements, side groups, etc. U internal : internal displacements of molecules, e.g. normal modes of vibration, torsions, etc. U atom : anisotropy of individual atoms

4
Rigid body model

5
Rigid body motion General displacement of atom (position r w.r.t. origin O) in rigid body: u = t + D.r For small libration : u t + r
 in rigid body: u = t + D.r For small libration : u t + r.")
6
TLS parameters Corresponding dyad: uu = tt + t r - r t - r r Average over dynamic motion and static disorder gives atomic anisotropic displacement parameter (ADP): U TLS = T + S T r - r S - r L r T, L and S describe mean square translation and libration of rigid body and their correlation. T 6 parameters, L 6 parameters, S 8 parameters

7
Use of TLS U TLS = T + S T r - r S - r L r Given refined U’s, fit TLS parameters - analysis Use TLS as refinement parameters TLS U’s structure factor - refinement

8
TLS in refinement TLS parameters are contribution to displacement parameters of model Can specify 1 or more TLS groups to describe contents of asymmetric unit (or part thereof) 6 + 6 + 8 = 20 parameters per group (trace of S is undetermined) Number of extra refinement parameters depends on how many groups used!
 = 20 parameters per group (trace of S is undetermined) Number of extra refinement parameters depends on how many groups used!")
9
At what resolution can I use TLS? Resolution < 1.2 Å - full anisotropic refinement Resolution ~ 1.5 Å - marginal for full anisotropic refinement. But can do detailed TLS, e.g. Howlin et al, Ribonuclease A, 1.45 Å, 45 side chain groups; Harris et al, papain, 1.6Å, 69 side chain groups. Resolution 1.5 Å - 2.5 Å model molecules/domains rather than side chains. Sandalova et al 2001 - thioredoxin reductase at 3.0 Å - TLS group for each of 6 monomers in asu

10
Implementation in REFMAC Suggested procedure: Choose TLS groups (currently via TLSIN file). Use anisotropic scaling. Set B values to constant value. Refine TLS parameters (and scaling parameters) against ML residual. Refine coordinates and residual B factors.
 against ML residual. Refine coordinates and residual B factors..")
11
NCS Different molecules in asymmetric unit may have different overall thermal parameters. Refine independent overall TLS tensors for each molecule. REFMAC can then apply NCS restraints to residual B values of NCS-related molecules.

12
TLSIN TLS Chain O NAD binding RANGE 'O 1.' 'O 137.' ALL RANGE 'O 303.' 'O 340.' ALL TLS Chain O Catalytic RANGE 'O 138.' 'O 302.' ALL TLS Chain Q NAD binding RANGE 'Q 1.' 'Q 137.' ALL RANGE 'Q 303.' 'Q 340.' ALL TLS Chain Q Catalytic RANGE 'Q 138.' 'Q 302.' ALL

14
Choice of TLS groups chemical knowledge, e.g. aromatic side groups of amino acids, secondary structure elements, domains, molecules best fit of TLS to ADPs of test structure, e.g. Holbrook & Kim (1984); rigid-body criterion applied to ADPs, e.g. Schneider (1996) dynamic domains identified from multiple configurations, e.g. more than one crystal form (DYNDOM), difference distance matrices (ESCET), MD simulations.
; rigid-body criterion applied to ADPs, e.g. Schneider (1996) dynamic domains identified from multiple configurations, e.g. more than one crystal form (DYNDOM), difference distance matrices (ESCET), MD simulations..")
15
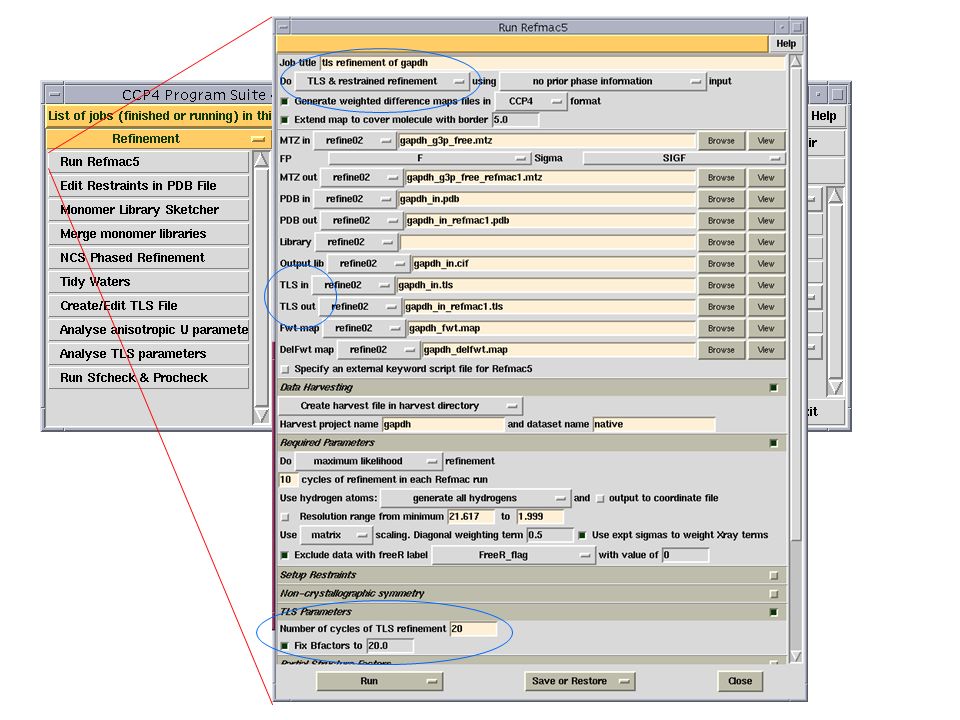
TLS - refmac5 interface Select TLS & restrained refinement at top of interface Specify TLS in and TLS out files. TLS Parameters folder: Number of cycles, e.g. 20 Fix Bfactors to e.g. 20 (value not crucial, but option is recommended)
.")
17
What to look for in output Usual refinement statistics. Check R_free and TLS parameters in log file for convergence. Check TLS parameters to see if any dominant displacements. Pass XYZOUT and TLSOUT through TLSANL for analysis Consider alternative choices of TLS groups

18
TLSOUT TLS Chain O NAD binding RANGE 'O 1.' 'O 137.' ALL RANGE 'O 303.' 'O 340.' ALL ORIGIN 94.142 6.943 75.932 T 0.5200 0.5278 0.5031 -0.0049 -0.0040 0.0081 L 0.11 0.08 0.04 -0.03 0.02 0.06 S -0.014 0.020 0.002 0.022 0.000 -0.016 -0.005 0.022.

19
Equivalent isotropic B factors TLS tensors U TLS for atoms in group. U TLS B TLS and anisotropy A Also have individually refined B res Hence, B TOT = B TLS + B res

20
Running TLSANL XYZIN: output coordinates from refmac with residual B factors (BRESID keyword) TLSIN: output TLS parameters from refmac TLSIN: ANISOU records including TLS and residual B contributions ATOM records containing choice of B (ISOOUT keyword) AXES: If AXES keyword set, file of principal axes in molscript format
 TLSIN: output TLS parameters from refmac TLSIN: ANISOU records including TLS and residual B contributions ATOM records containing choice of B (ISOOUT keyword) AXES: If AXES keyword set, file of principal axes in molscript format")
22
Output of TLSANL Origins ( T and S, but not L, origin-dependent): Origin of calculation Centre of Reaction Axial systems for each tensor: orthogonal librational “ Simplest” description: 3 non-intersecting screw axes + 3 reduced translations
: Origin of calculation Centre of Reaction Axial systems for each tensor: orthogonal librational Simplest description: 3 non-intersecting screw axes + 3 reduced translations")
23
Displaying derived ADPs ORTEP: http://www.ornl.gov/ortep/ortep.html Mapview: http://www.chem.gla.ac.uk/~paule/chart/ xtalview: http://www.scripps.edu/pub/dem-web/toc.html Rastep in RASTER3D : using the script: grep NAD file.pdb | rastep -auto -Bcol 5. 35. > ellipsoids.r3d render -jpeg ellipsoids.jpeg Xfit: http://www.ansto.gov.au/natfac/asrp7_xfit.html povscript: http://people.brandeis.edu/~fenn/povscript

24
11 a.a. (8% of TLS group) 30% probability level
 30% probability level")
25
Ex. 1 - mannitol dehydrogenase Hörer et al., J.Biol.Chem. 276, 27555 (2001) 1.5 Å data 3 tetramers in a.s.u. TLS refinement with 1 group per monomer Free-R 23.6% 20.9% TetramerB’s before TLS B’s after TLScrystal contacts ABCD27.113.338 EFGH18.013.350 IJKL18.613.349
 1.5 Å data 3 tetramers in a.s.u. TLS refinement with 1 group per monomer Free-R 23.6% 20.9% TetramerB’s before TLS B’s after TLScrystal contacts ABCD EFGH IJKL")
26
Ex. 2 - light harvesting complex Complex is nonamer. Each monomer contains: peptide peptide 2 x B850 bacteriochlorophyll 1 x B800 bacteriochlorophyll 2 x carotenoids Crystallographic asu = 3 monomers

27

28
TLS models a) 1 group for a.s.u. (20 parameters) b) 1 group per NCS unit (3 x 20 pars) c) 1 group per molecule (18 x 20 pars) d) 3 groups per peptide + 1 group per pigment (total 30 x 20 parameters)
 b) 1 group per NCS unit (3 x 20 pars) c) 1 group per molecule (18 x 20 pars) d) 3 groups per peptide + 1 group per pigment (total 30 x 20 parameters).")
30
Ex. 3 - peptide-MHC complexes Markus Rudolph Class I peptide-MHC complexes (1.7 Å – 1.9 Å) Alpha chain – 1 or 2 TLS groups Beta chain – 1 TLS group Bound peptide – 1 TLS group Free R decrease 22.3 to 21.1 in best case. Eigenvalues of L for peptide: 64.7 0.9 -4.1
 Alpha chain – 1 or 2 TLS groups Beta chain – 1 TLS group Bound peptide – 1 TLS group Free R decrease 22.3 to 21.1 in best case. Eigenvalues of L for peptide:")
31
Example 4 - GAPDH Glyceraldehyde-3-phosphate dehydrogenase from Sulfolobus solfataricus (M.N.Isupov et al, JMB, 291, 651 (1999)) 340 amino acids 2 chains in asymmetric unit (O and Q), each molecule has NAD-binding and catalytic domains. P4 1 2 1 2, data to 2.05Å

32
GAPDH: R factors ModelTLS groupsR factorR free 1023.830.4 21*25.129.4 3121.425.9 4221.226.2 5421.125.8 * B factors constant at 20 Å 2

33
TLS values - 1 TLS group Eigenvalues of reduced translation tensor: 0.267 Å 2 0.112 Å 2 – 0.005 Å 2 Eigenvalues and pitches of screw axes: 1.403 ( ) 2 0.888 Å 1.014 ( ) 2 1.472 Å 0.204 ( ) 2 1.214 Å
 Å ( ) Å ( ) Å")
34
Screw axes - 1 TLS group

35
Contributions to equivalent isotropic B factor

36
B’s from NCS-related chains

37
Correlations between NCS-related B's ModelTLS groupsR factorR free CorrCoeff 1023.830.40.537 21*25.129.4 - 3121.425.90.752 4221.226.20.812 5421.125.80.821 CorrCoeff - mean correlation coefficient between (residual) B factors of NCS-related chains
 B factors of NCS-related chains")
38
Application of NCS restraints ModelTLS groupsNCSR factorR free CorrCoeff 10no23.830.40.537 60yes25.030.30.989 54no21.125.80.821 74yes22.025.70.999 NCS - whether NCS restraints applied

39
Example 5: GerE transcription regulator from Bacillus subtilis (Ducros et al). 74 amino acids six chains A-F in asymmetric unit C2, data to 2.05Å

40
GerE

41
GerE: R factors ModelTLS groupsR factorR free 1021.929.3 2621.327.1

42
Contributions to equivalent isotropic B factor

43
B’s from NCS-related chains

44
GerE: NCS ModelTLS groupsNCSR factorR free CorrCoeff 10no21.929.30.519 30yes22.530.00.553 26no21.327.10.510 46yes21.427.20.816 NCS - whether NCS restraints applied CorrCoeff - mean correlation coefficient between (residual) B factors of NCS-related chains
 B factors of NCS-related chains")
45
Choice of TLS groups 6 groups - each group split between 2 chains (for illustration only!) ModelTLS groupsR factorR free 1022.530.0 2621.427.2 5622.228.6
 ModelTLS groupsR factorR free")
46
Choice of TLS groups

48
Inclusion of bound waters 6 TLS groups, with some waters included, WatersR factorR free None21.427.2 1 shell, cutoff 2.821.527.4 1 shell, cutoff 3.221.527.2 2 shell, cutoff 3.221.627.2

49
Acknowledgements BBSRC (CCP4 grant) Garib Murshudov Miroslav Papiz (LH2) Stefan Hörer (mannitol dehydrogenase) Markus Rudolph (MHC) Misha Isupov (GAPDH) Valerie Ducros, Jim Brannigan, Tony Wilkinson (GerE)
 Garib Murshudov Miroslav Papiz (LH2) Stefan Hörer (mannitol dehydrogenase) Markus Rudolph (MHC) Misha Isupov (GAPDH) Valerie Ducros, Jim Brannigan, Tony Wilkinson (GerE)")
Similar presentations


EVER WANTED TO KNOW Julia M. Goodfellow Dynamic Processes: Lecture 1 Lecture Notes.>")


 A. Vagin, F. Long, J. Foadi, A. Lebedev G. Murshudov Chemistry Department, University of York.>")