Download presentation
Presentation is loading. Please wait.

1
Day 4: Applications of Graphing Exponential Functions

2
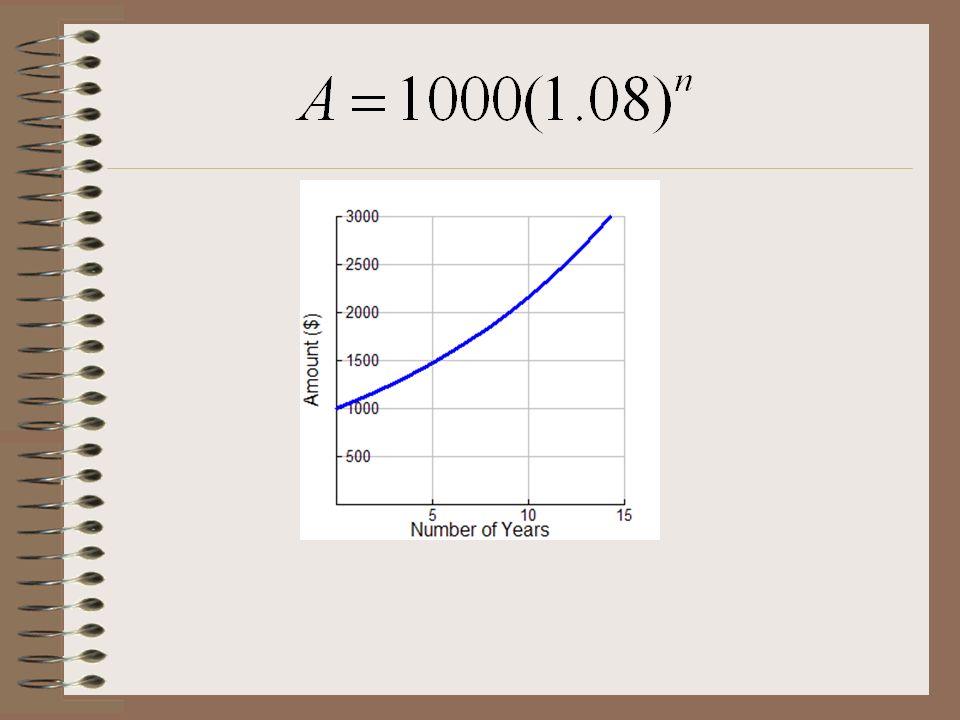
Compound Interest Suppose you make a long-term investment of $1000 at a fixed interest rate of 8% compounded annually. The amount A dollars of your investment after n years is represented by the equation

4
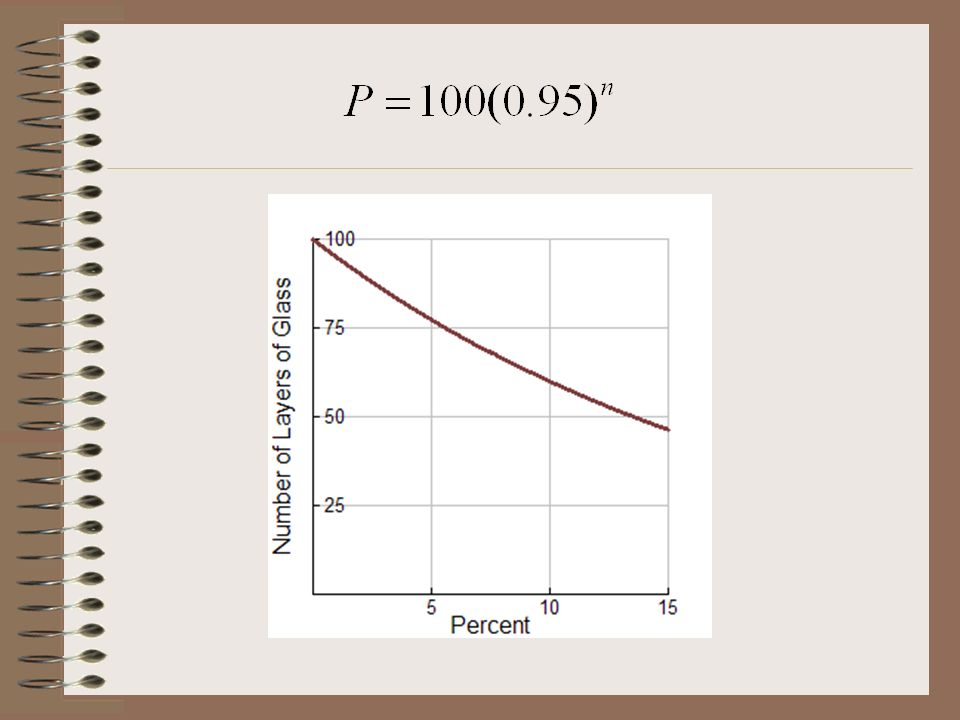
Light Transmission Through Glass
Several layers of glass are stacked together. Each layer reduces the light passing through it by 5%. The percent P of light passing through n layers is represented by the equation

6
Comparing the Equations
The two situations are examples of Exponential Growth and Exponential Decay Exponential Growth Exponential Decay Initial Value Decay Factor (Less than 1) Initial Value Growth Factor (Greater than 1)
 Initial Value. Growth Factor (Greater than 1)")
7
Graphing Exponential Functions
There are two ways in which we will graph exponential functions: Using a graphing calculator Using a table of values, paper and pencil

8
Example 1: Using a Graphing Calculator
The first artificial satellites were put in orbit in the late 1950s. The cumulative mass, c tonnes, of all the satellites in orbit can be modelled as a function of n, the number of years since 1960 by the equation:

9
a) Graph the equation using a graphing calculator
Use appropriate window settings. What makes sense? Try:

10
b) Estimate the cumulative mass in 1969, the year when a person first walked on the moon?
Two ways of solving: Use the graph to estimate Substitute 9 for n in the equation Answer: Approx 333 tonnes

11
c) According to the model, when did the cumulative mass become 4000 t?
Two ways of solving: Use the trace function on your graphing calculator to trace to the point where the y-coordinate is closest to 4000 2. Graph y = 4000 and find the point of intersection of the two graphs Answer: Approx 31 years after 1960 or 1991

12
Example 2: Using a Table of Values
Coffee, tea, cola, and chocolate contain caffeine. When you consume caffeine, the percent, P, left in your body can be modelled as a function of the elapsed time, n hours, be the equation:

13
a) Use a table of values and graph the equation.
What would the domain and range be? Use this to determine what numbers to use in your table of values.

14
b)Determine how long it takes until only 20% of the caffeine remains.
Use your graph to estimate. Answer: Approx hours

15
Homework Complete the handout during class time.
If you are unable to complete it during this time, you must complete all graphs at home by hand.

Similar presentations


. The y- intercept is 10, so a.>")


 = ab x Where a > 0 BUT: 0 < b < 1 (a fraction between 0 & 1)>")


 Find the equation for y given.>")


