Download presentation
Presentation is loading. Please wait.

2
Letter of Explanation

3
Copy of Data Disproportionality Initial Eligibility 60-day Timeline Early Childhood Transition Secondary Transition Corrected and Verified Noncompliance within 365 days Accurate & Timely Data Total 9 & 10 11 12 13 15 20 100% - 90% 3 = 0 over 3 = 75-100% timely or 1 late 3 = 75-100% or 1 (13 not met) 3 = On time 89% - 75% 2 = 1-2 areas over 2 = 50-74% timely or 2 late 2 = 50-74% or 2 (13 not met) 0 = Late 74% - 50% 1 = 3 areas over 1 = 30-49% timely 1 = 30-49% 49% - 0% 0 = 4+ areas over 0 = 0-29% timely or 3 late 0 = 0-29% or 3 (13 not met)
 3 = On time 89% - 75% 2 = 1-2 areas over 2 = 50-74% timely or 2 late 2 = 50-74% or 2 (13 not met) 0 = Late 74% - 50% 1 = 3 areas over 1 = 30-49% timely 1 = 30-49% 49% - 0% 0 = 4+ areas over 0 = 0-29% timely or 3 late 0 = 0-29% or 3 (13 not met)")
4
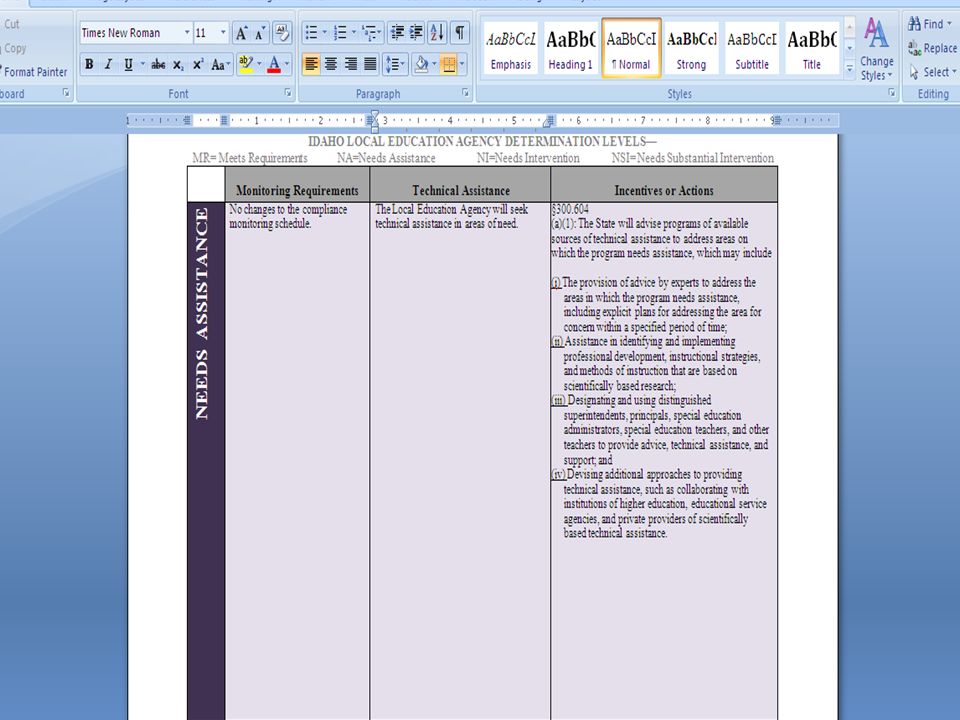
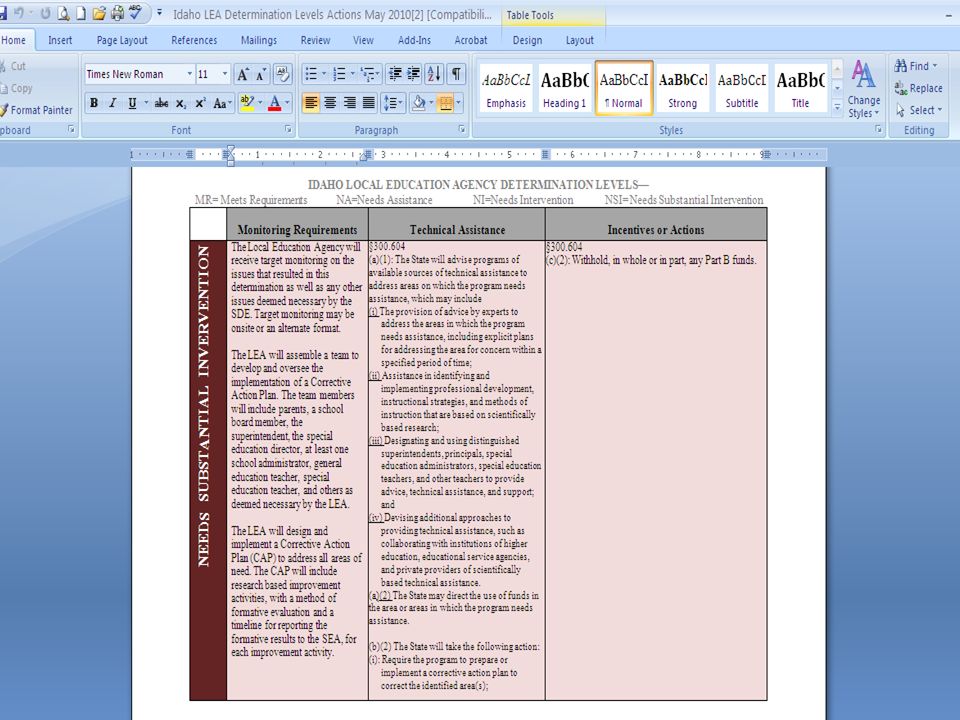
Monitoring RequirementsTechnical AssistanceIncentives or Actions MEETS REQUIREMENTS No changes to compliance monitoring schedule Upon request the Local Education Agency may receive technical assistance on general areas of need. The Local Education Agency will receive a letter of recognition from State Education Agency.

5
IDEA Below are Office of Special Education Programs (OSEP) requirements for States as stated in an FAQ document: States are required to enforce the IDEA by making “determinations annually under IDEA section 616(e) on the performance of each LEA under Part B”
 requirements for States as stated in an FAQ document: States are required to enforce the IDEA by making determinations annually under IDEA section 616(e) on the performance of each LEA under Part B")
6
IDEA States must use the same four categories in IDEA section 616(d) as OSEP in making determinations of the status of LEAs/EIS programs. These categories are: Meets Requirements; Needs Assistance; Needs Intervention; and Needs Substantial Intervention.

7
IDEA States MUST consider: Performance on compliance indicators; Whether data submitted by LEAs programs are valid, reliable, and timely; Uncorrected noncompliance from other sources; and Any audit findings.

8
IDEA In addition, States could also consider: Performance on performance indicators; and Other information

9
Monitoring Workgroup Participants Directors Superintendents Parent Group Regional Consultant Central Office Staff Across the Regions Large and Small Districts Debby Lund, Pat Farmer, JoAnn Curtis, Desi Laughlin, Mert Burns, Mel Wiseman, Mike Haberman, Charlie Silva, Cathy Thornton, Frank Howe, Evelyn Mason, Marybeth Flachbart, Jean Taylor, Jacque Hyatt, Jodie Mills, Gina Hopper and Janice Carson

10
Monitoring Workgroup Advise the SDE: Monitoring Process and Procedures Timelines Guidelines Determination Criteria

11
What are our Compliance Indicators? Indicators 9 & 10- Disproportionality of race/ethnicity that is due to use of inappropriate practices and/or procedures Indicator 11- Timely initial eligibility determinations (within 60 days of receiving parental consent) Indicator 12- Early childhood transitions (from Part C to Part B) are completed by the child’s 3 rd birthday. Indicator 13- Secondary transitions are compliant on all 8 questions. Indicator 15- Noncompliance findings are corrected by the due date and any required Corrective Action (usually from a complaint) is completed by the due date. Indicator 20- Data for Child Count, Exiting, and Discipline is submitted by the due date and is accurate.
 Indicator 12- Early childhood transitions (from Part C to Part B) are completed by the child’s 3 rd birthday. Indicator 13- Secondary transitions are compliant on all 8 questions. Indicator 15- Noncompliance findings are corrected by the due date and any required Corrective Action (usually from a complaint) is completed by the due date. Indicator 20- Data for Child Count, Exiting, and Discipline is submitted by the due date and is accurate..")
12
Compliance Indictors Disproportionality Initial Eligibility 60-day Timeline Early Childhood Transition Secondary Transition Corrected and Verified Noncompliance within 365 days Accurate & Timely Data Total 9 & 10 11 12 13 15 20 100% - 90% 3 = 0 over 3 = 75-100% timely or 1 late 3 = 75-100% or 1 (13 not met) 3 = On time 89% - 75% 2 = 1-2 areas over 2 = 50-74% timely or 2 late 2 = 50-74% or 2 (13 not met) 0 = Late 74% - 50% 1 = 3 areas over 1 = 30-49% timely 1 = 30-49% 49% - 0% 0 = 4+ areas over 0 = 0-29% timely or 3 late 0 = 0-29% or 3 (13 not met)
 3 = On time 89% - 75% 2 = 1-2 areas over 2 = 50-74% timely or 2 late 2 = 50-74% or 2 (13 not met) 0 = Late 74% - 50% 1 = 3 areas over 1 = 30-49% timely 1 = 30-49% 49% - 0% 0 = 4+ areas over 0 = 0-29% timely or 3 late 0 = 0-29% or 3 (13 not met)")
13
Indicators 9 & 10 Disproportionality What is it? Disproportionality is over-representation of race/ethnicity that is due to using inappropriate policies, practices, or procedures to identify students as having a disability. This can be in either the overall special education program or by specific disability areas. Where do you get this data? December 1 Child Count compared to fall enrollment by ethnicity. (FYI…If there is over identification due to policy practice or procedures, the director received an email and the superintendent received and letter. Prior to notices, the district is given an opportunity to explain the data and send in additional eligibility reports that are reviewed by SDE staff. If after review of these documents, the over representation is due to policy, practice or procedures, the notices were sent.)
.")
14
3 = 0 over 2 = 1-2 areas over 1 = 3 areas over 0 = 4+ areas over Indicators 9 & 10 Disproportionality

15
Indicator 11 Initial Eligibility What is it? The eligibility must be determined prior to 60 days from receipt for permission to test. Where do you get this data? This is collected at the end of the school year. We are collecting this information right now for next years determination levels. (FYI…If you are not at 100% on this indicator, you will receive a notice of noncompliance from the Compliance Tracking Tool in November that will have to be corrected and verified prior to May 1 of that school year.)
.")
16
Indicator 11 Initial Eligibility 3 = 75-100% timely or 1 late 2 = 50-74% timely or 2 late 1 = 30-49% timely 0 = 0-29% timely or 3 late

17
Indicator 12 Early Childhood Transition What is it? Transition from Infant Toddler(Part C) to school districts (Part B), so that the IEP is in place by the student's 3rd birthday. Where do you get this data? This is collected at the end of the school year through September 30 th of the coming school year. (FYI…If you are not at 100% on this indicator, you will receive a notice of noncompliance from the Compliance Tracking Tool in November that will have to be corrected and verified prior to May 1 of that school year.)
 to school districts (Part B), so that the IEP is in place by the student s 3rd birthday. Where do you get this data. This is collected at the end of the school year through September 30 th of the coming school year. (FYI…If you are not at 100% on this indicator, you will receive a notice of noncompliance from the Compliance Tracking Tool in November that will have to be corrected and verified prior to May 1 of that school year.).")
18
Indicator 12 Early Childhood Transition 3 = 75-100% timely or 1 late 2 = 50-74% timely or 2 late 1 = 30-49% timely 0 = 0-29% timely or 3 late

19
Indicator 13 Secondary Transition What is it? There are 8 questions on the Secondary Transition Checklist that must be "Yes" or "NA" to receive credit for Indicator 13. 1) Parent meeting invitation includes student on list of those invited. 2) If appropriate, a representative from an outside agency was invited to the IEP Team meeting. 3) IEP includes measurable Post School Goals covering education or training, employment and, as needed independent living. 4) Post School Goals are developed based on information gathered through age appropriate assessment in transition related areas, including a functional vocational evaluation if needed. 5) Post School Goals are reviewed and updated annually as needed. 6) IEP includes a Course of Study (embedded or attached) to reach their Post School Goals. 7) IEP includes Transition Services (activities, related services) to reach their identified Post School Goals. 8) IEP annual goals assist the student to reach their identified Post School Goals. Where do you get this data? Secondary Transition, Indicator 13, data is collected the year the agency/district is in the first year of the monitoring cycle called Self Assessment Monitoring (SAM). (FYI…If you are not at 100% on this indicator, you will receive a notice of noncompliance from the Compliance Tracking Tool in May that will have to be corrected and verified prior to May 1 of the following year.)
 Parent meeting invitation includes student on list of those invited. 2) If appropriate, a representative from an outside agency was invited to the IEP Team meeting. 3) IEP includes measurable Post School Goals covering education or training, employment and, as needed independent living. 4) Post School Goals are developed based on information gathered through age appropriate assessment in transition related areas, including a functional vocational evaluation if needed. 5) Post School Goals are reviewed and updated annually as needed. 6) IEP includes a Course of Study (embedded or attached) to reach their Post School Goals. 7) IEP includes Transition Services (activities, related services) to reach their identified Post School Goals. 8) IEP annual goals assist the student to reach their identified Post School Goals. Where do you get this data. Secondary Transition, Indicator 13, data is collected the year the agency/district is in the first year of the monitoring cycle called Self Assessment Monitoring (SAM). (FYI…If you are not at 100% on this indicator, you will receive a notice of noncompliance from the Compliance Tracking Tool in May that will have to be corrected and verified prior to May 1 of the following year.).")
20
Indicator 13 Secondary Transition 3 = 75-100% or 1 (13 not met) 2 = 50-74% or 2 (13 not met) 1 = 30-49% 0 = 0-29% or 3 (13 not met)
 2 = 50-74% or 2 (13 not met) 1 = 30-49% 0 = 0-29% or 3 (13 not met)")
21
Indicator 15 Correction of Noncompliance What is it? All noncompliance found in the monitoring process must be corrected and verified prior to the due date. The noncompliance is found in the SAM year, Child Count Verification, dispute resolution findings, Indicator 9, 10, 11, 12, and 13 data as well as all corrective action plans from onsite visits. Where do you get this data? The data is recorded in the Compliance Tracking Tool, the Dispute Resolution Database and follow up on individual district written corrective action plans. (FYI…All correction of noncompliance must be corrected and verified by the due date.)
.")
22
Indicator 15 Correction of Noncompliance 3 = On time 0 = Late

23
Indicator 20 Timely and Accurate Data What is it? The SDE takes into consideration only Child Count, Exiting, and Discipline Data. Where do you get this data? There are time stamps for each one of these data collection systems.

24
Indicator 20 Timely and Accurate Data

28
Idaho’s Determinations

29
Idaho Determination Level

30
Meets Requirements Thank You!

Similar presentations


 and>")

 State Assessment Participation/Performance (Assessment)>")


>")

 September 27-29, 2010.>")
 Fall Forum Tuesday, November 4, 2013 10:15 am – 11:45 am Ballroom E Jayme Kraus Data Analyst, Performance Reporting.>")
