Download presentation
Presentation is loading. Please wait.

1
Variability Characteristics of Structural Health Monitoring Data and Development of Engineering Report Tool Nicolás A. Londoño David T. Lau Department of Civil & Environmental Engineering Carleton University Ottawa, Canada SAMCO Summer Academy Zell am See, Austria Sept 5-9, 2005

2
Overview ► Introduction ► Computer Tools ► Research using Confederation Bridge field monitoring data 1.Design properties verification 2.Variability of monitoring data ► Engineering Report Tool ► Conclusions

3
Confederation Bridge

6
Monitoring System Sensors Data logger On Site Computers Carleton University Processing Internet Analysis (System Identification) Frequency Mode-shape Damping ratios Condition Assessment Engineering Reporting and Interpretatio n LAN
 Frequency Mode-shape Damping ratios Condition Assessment Engineering Reporting and Interpretatio n LAN")
7
Wind scenarioTraffic scenario 40 seconds 600 seconds Data characteristics

8
Wind scenarios Traffic scenarios

9
Stochastic Subspace Identification Data cross-correlations Output-only monitoring data Block Toeplitz Matrix Singular Value Decomposition Stochastic State-Space Model Matrices Frequencies Mode Shapes Damping Ratios State Space model

10
SPPLASH – Signal Processing PLatform for Analysis of Structural Health

11
Identified 2.76 Hz Theoretical 2.59 Hz MAC 0.89

13
Verification Study – Modal Frequencies – Mode Number Type EXPERIMENTAL FREQUENCY Experimental – Theoretical Frequency Difference Mean(Hz)Min (Hz) (Hz)Max Range of Variability(%)Std (% of mean) (% of mean) Beam E35 (%) (%) Beam E43 (%) (%) Shell E35 (%) (%) Shell E43 (%) (%) 1T0.340.320.37165.822106-4 2T0.470.460.4851.42-8-3-12 3V0.570.520.63196.8219154 4V0.650.640.66311213-7 5V0.680.650.7192.110-- 7V0.920.890.95721657-4 8V0.970.950.9941.5187-- 10V1.621.61.6641.3---- 11V1.811.781.8651.213210 12V2.732.702.7930.9175-- 13V2.832.762.9152.01547-3 14V2.882.832.9441.7---- 16TP31-To3.303.263.3431.0--4-6 18V3.43.293.4751.5---- 19V-L3.793.713.9251.82311105 234.714.664.7420.6---- 25V5.135.035.2031.3165-- Averages---4.81.81547-3
Min (Hz) (Hz)Max Range of Variability(%)Std (% of mean) (% of mean) Beam E35 (%) (%) Beam E43 (%) (%) Shell E35 (%) (%) Shell E43 (%) (%) 1T T V V V V V V V V V V TP31-To V V-L V Averages")
14
Verification Study – Modal Damping and MAC – Mode Number Frequency MODAL DAMPING RATIOS ( ) MODAL ASSURANCE CRITERION (MAC) Mean (%) StandardDeviation (% of mean) Experimental Experimental vs. FE (shell) 1 0.341.9660.940.89 2 0.471.7390.900.85 3 0.573.8370.820.87 4 0.651.4730.890.97 5 0.682.1370.85- 7 0.921.5420.910.98 8 0.971.6420.92- 10 1.621.6700.93- 11 1.811.5530.940.96 12 2.730.8520.91- 13 2.831.3570.920.89 14 2.881.0590.89- 16 3.300.6480.560.73 18 3.40.8500.90- 19 3.790.9570.910.58 23 4.710.8420.85- 25 5.130.8480.86- Averages-1.3540.880.79
 Averages")
15
Variability -Sources- ► Numerical uncertainties Deviation from model assumptions ► Data non-stationarity ► Non-whiteness of the inputs Measurement noise Computational uncertainties ► Use of finite datasets ► Analyst input ► Physical Uncertainties Environmental and loading fluctuations ► Temperature effects ► Bridge-vehicle coupling, etc.

17
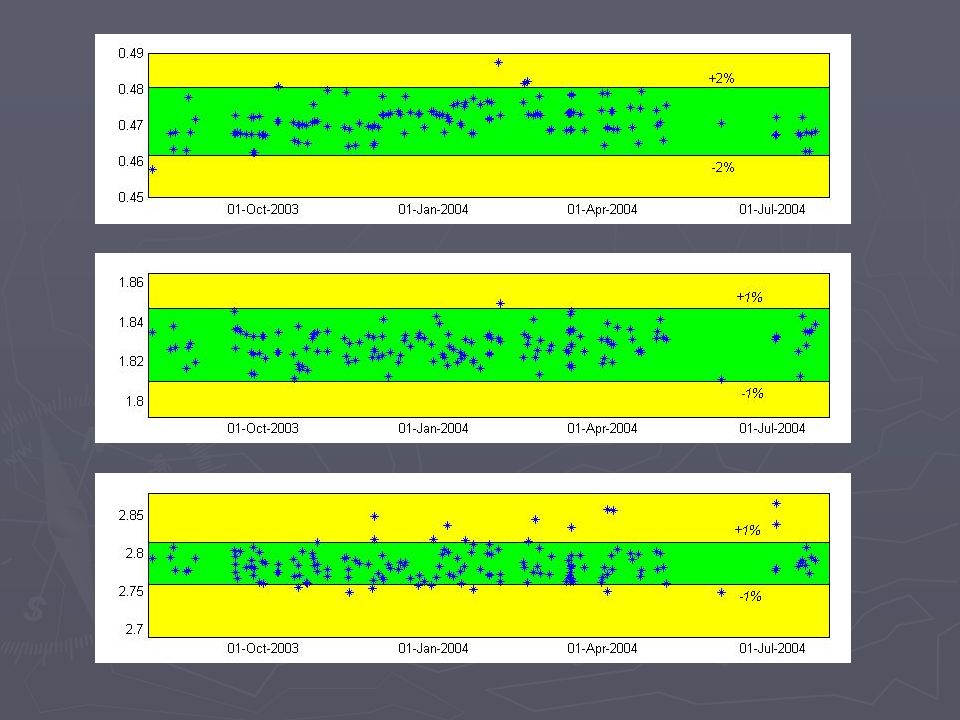
Baseline Variability

18
Mode shape variability

19
Baseline variability

20
General variability

21
Temperature Effect Temperature (Hz) Modal Frequency (Hz)
 Modal Frequency (Hz)")
24
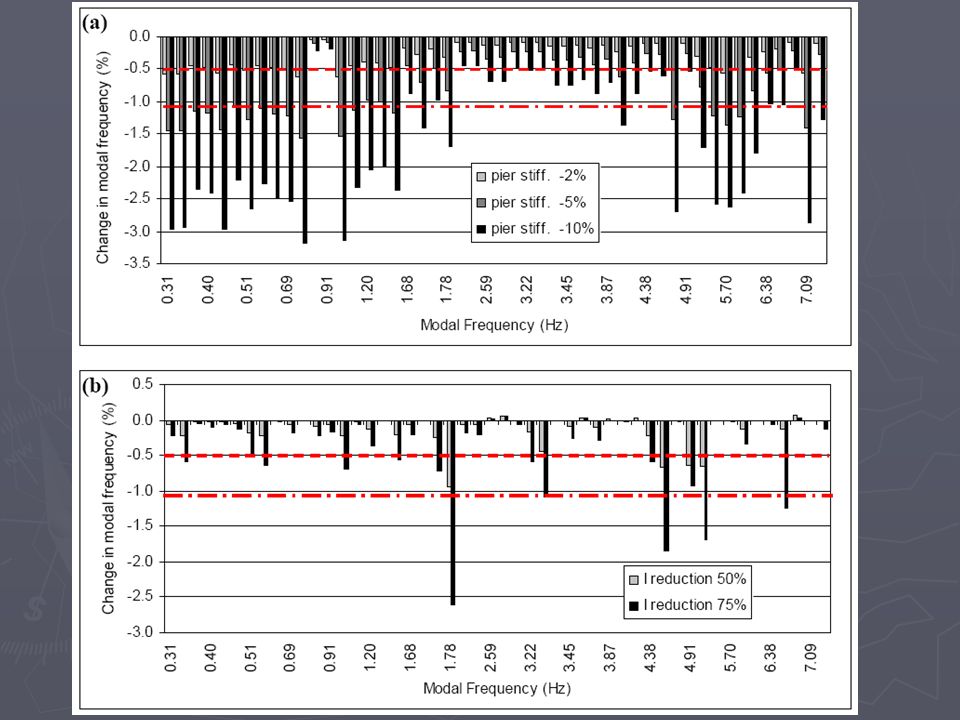
Variability vs. sensitivity

28
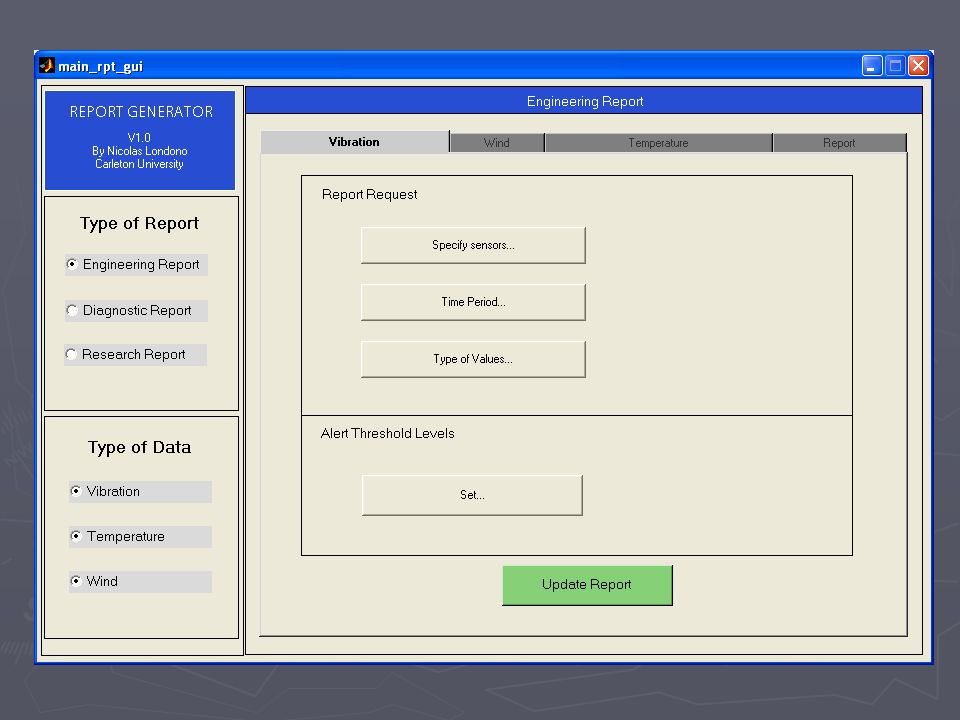
Engineering Report Tool ► Motivation Enhance feedback given to bridge owners and operators Provide timely systematic information of engineering relevance for decision support ► Requirements Automated file sorting and processing Easy to search database

37
END

38
Confederation Bridge Monitoring Data ► Truck Traffic induced vibration ► Wind storm (Nov. 7 2001) ► Typical ambient vibration
 ► Typical ambient vibration.")
Similar presentations