Download presentation
Presentation is loading. Please wait.

1
Power Sector Planning and Development: Lessons from Thailand’s and international experience Chuenchom Sangarasri Greacen 9 March 2013 WORKSHOP ON “ELECTRIC POWER DEVELOPMENT & CHALLENGES IN MYANMAR: SHARING EXPERIENCES OF THE MEKONG REGION” Tonga Puri Hotel, Nay Pyi Taw, Myanmar

2
The engine of sustainable economic & social development Environment People (peace, democracy, justice) Improved living standards & economic opportunity: -Wealth generation -Access to electricity -Education -Health Electricity
 Improved living standards & economic opportunity: -Wealth generation -Access to electricity -Education -Health Electricity")
3
Power sector planning in a nutshell Mechanism: Assess needs, Source supply To meet objectives (e.g. reliability, job creation) At reasonable price Approaches to planning: Centralized (top-down) Decentralized (bottom-up) Approaches to electrification Off-grid/mini-grid Grid extension
 At reasonable price Approaches to planning: Centralized (top-down) Decentralized (bottom-up) Approaches to electrification Off-grid/mini-grid Grid extension.")
4
Centralized & decentralized generation Gasifier/ Solar farm/ Biogas Plant Cogeneration Biomass Plant/ Large solar farm HV substation Distribution transformer LV distribution MV distribution HV Transmission

5
Power sector planning in a nutshell Mechanism: Assess needs, Source supply To meet objectives (e.g. reliability, job creation) At reasonable price Approaches to planning: Centralized (top-down) Decentralized (bottom-up) Approaches to electrification Off-grid/mini-grid Grid extension There may not be a “one-size-fit-all” solution Diverse context and situation require diverse approaches What is the best approach for a country?
 At reasonable price Approaches to planning: Centralized (top-down) Decentralized (bottom-up) Approaches to electrification Off-grid/mini-grid Grid extension There may not be a one-size-fit-all solution Diverse context and situation require diverse approaches What is the best approach for a country .")
6
Large Plants Customers Small Power Producer Mini-Grid Customers Parallel approach: extending the grid and encouraging rural mini-grids National Grid Top-downBottom-up

7
Thailand’s approach Rural electrification = grid expansion + mini-grid – Community-scale power generation systems (e.g. microhydro) were forced to abandon their generation and mini-grids when grid electricity arrived Centralized, monopoly (single buyer) model with strong emphasis on large-scale generation Deterministic forecast, top-down planning process Little participation in decision-making and sector development
 were forced to abandon their generation and mini-grids when grid electricity arrived Centralized, monopoly (single buyer) model with strong emphasis on large-scale generation Deterministic forecast, top-down planning process Little participation in decision-making and sector development.")
8
Planning of capacity additions (Total capacity requirement = peak demand + 15% reserve margin)
")
9
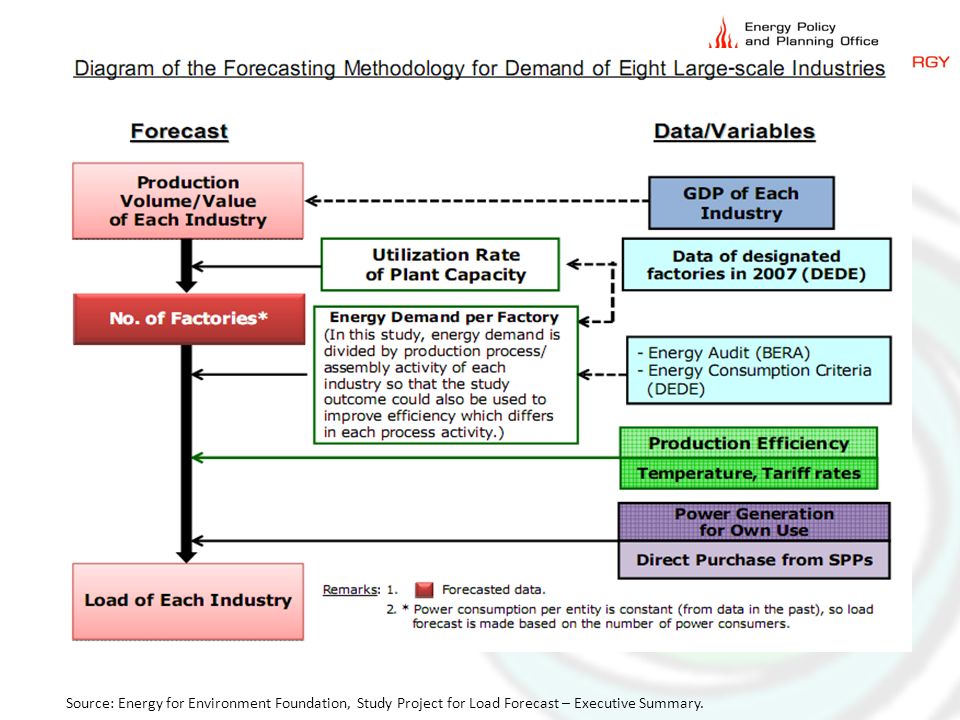
Demand forecast Demand treated as given Deterministic model – Main assumptions: GDP growth Energy elasticity (electricity growth/GDP growth) Population growth Econometric model with some end-use data (e.g. floor space for offices or appliance ownership and efficiency for residential sector) if available
 if available.")
10
Source: Energy for Environment Foundation, Study Project for Load Forecast – Executive Summary.

11
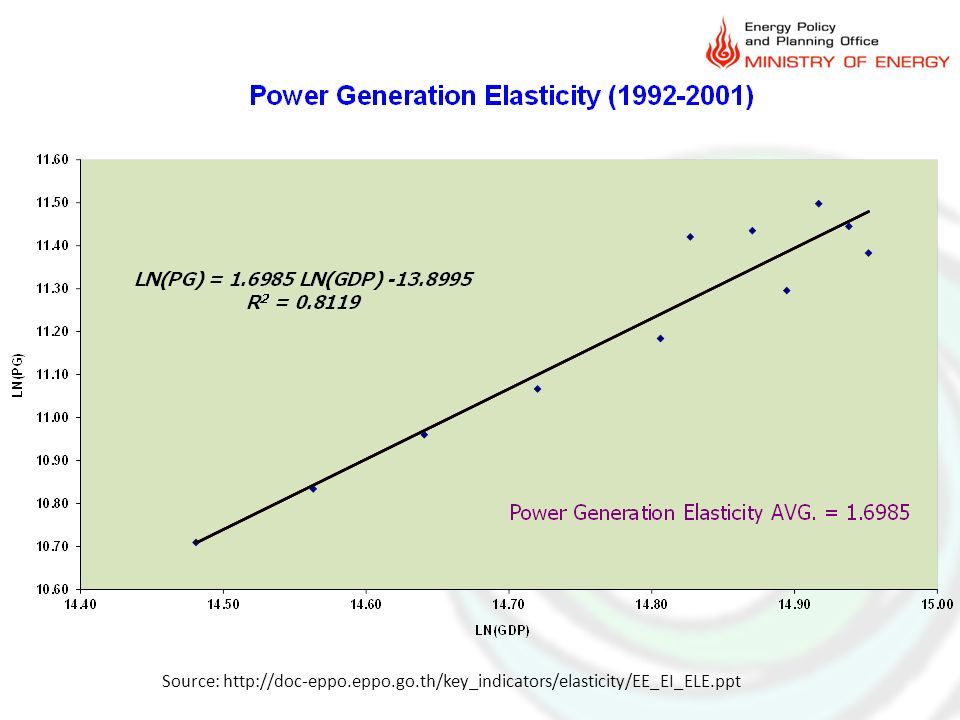
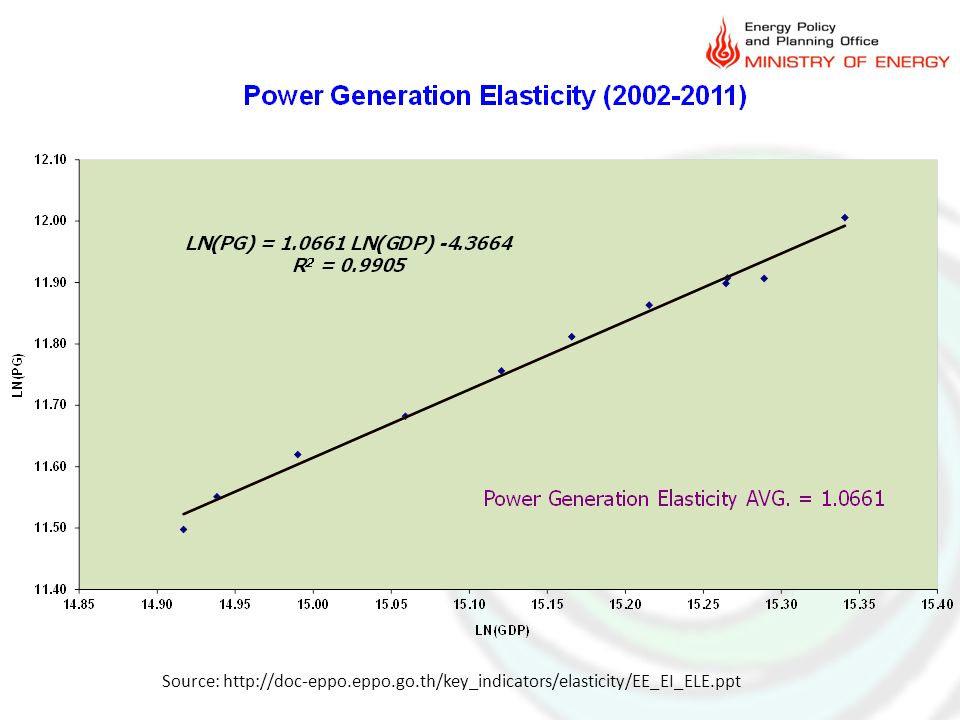
Energy demand is 1.4 times higher than GDP growth Source : EIA,DOE, BP Statistic Review of World Energy, EGAT Energy Elasticity = ∆ t Energy Consumption/ ∆ t GDP Ave. Energy Elasticity 1.4 : 1.0 New Target 1 : 1 or lower Thailand The government used to assume a constant Energy Elasticity of 1.4 but the assumption did not hold.

12
Choice of supply options considered in the PDP by EGAT 700 MW Coal-fired power plant 700 MW gas-fired combined cycle plant 230 MW gas-fired open cycle plant 1,000 MW nuclear plant Hydro imports are politically negotiated outside of PDP process DSM/EE, RE, Distributed generation not integrated in the optimization process

13
EGAT (also MEA & PEA) became “Poster-child” of World Bank, other foreign aid institutions – Access to soft loans, technical assistance, etc. – Rapid growth of sector and electrification rates – Rapid economic growth and industrial development Outcome of Thai top-down, centralized, monopoly model

14
Thailand’s Fuel Mix for Power Generation

15
Many successes but there are also lessons learned… Over-projection of GDP and demand forecasts leading to cycle of over-investments Abandonment and discrimination of community- scale, decentralized energy systems High dependency on imports Impacts and conflicts Inequality Inefficiency Uncompetitive and debt-ridden economy

16
Comparison of GDP: forecast vs. actual PDP2007 forecast Case20072008200920102011 5-yr Avg20122013201420152016 5-yr Avg Low 44.54.74.5 4.4 4.8555.3 5.1 Base 4.855.255 5.0 5.35.5 5.8 5.6 High 55.55.75.5 5.4 5.8666.3 6.1 Actu al 5.02.5-2.37.81.0*2.8 *Bank of Thailand's estimate, as reported in Matichon newspaper on Feb 4, 2012 GDP is the main assumption affecting the power demand forecast Assumptions of GDP growth used in PDP2007 vs Actual.

17
Past demand forecasts compared to actual peak demand (MW) Used in PDP2010 Actual demand
 Used in PDP2010 Actual demand")
18
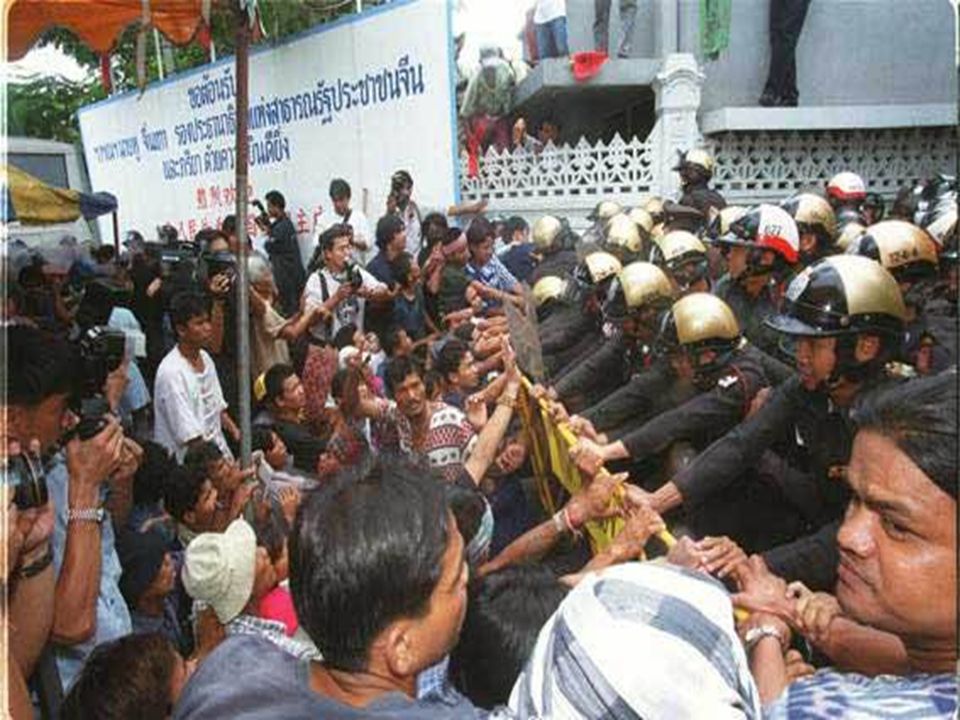
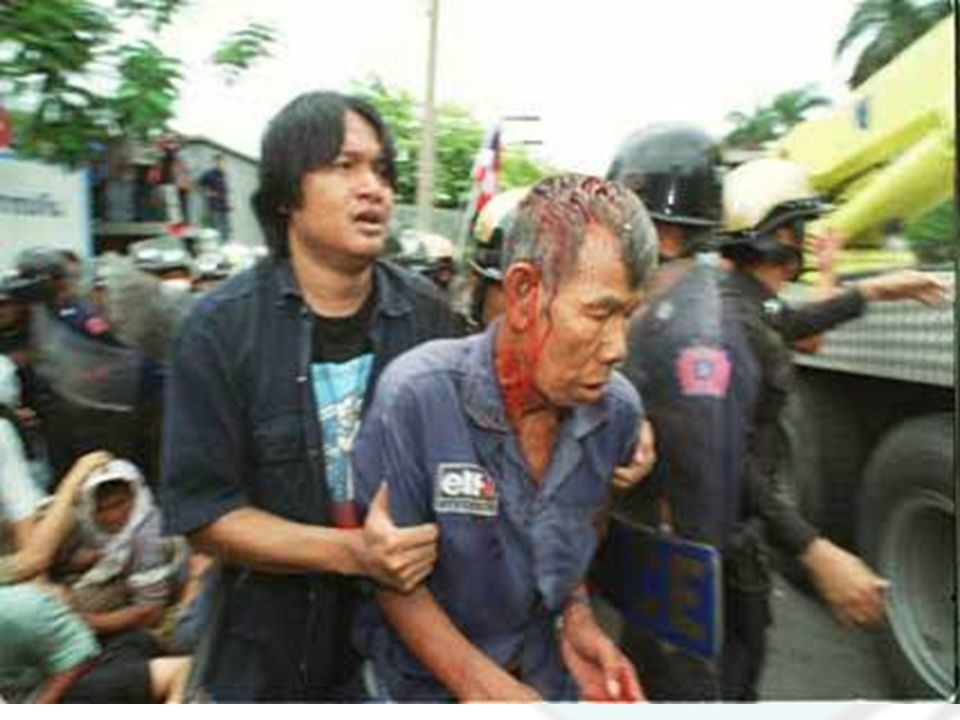
Over-projections of demand leads to… Over-expansion Cycles of over-investments and burden on ratepayers No incentive to promote energy efficiency and renewable energy Unnecessary social, environmental impacts – Conflicts, violence and inequality

19
Pak Mun Dam Story A World Bank funded project completed in 1994 Run-of-river 126 MW hydroelectric dam on a main tributary of Mekong River Source of on-going conflicts due to impacts on fish migration and livelihood of people Photo: http://en.wikipedia.org/wiki/Pak_Mun_dam

23
Electricity production and consumption (GWh) 1700 families relocated Loss of livelihood for >6200 families Loss of 116 fish species (44%) Fishery yield down 80% 65 Mae Hong Song Source: MEA, EGAT, Searin, Graphic: Green World Foundation Dams Shopping Malls Pak Mun Dam Impacts of Pak Mun Dam alone MBK 123 81 75 Siam Paragon Central World
 1700 families relocated Loss of livelihood for >6200 families Loss of 116 fish species (44%) Fishery yield down 80% 65 Mae Hong Song Source: MEA, EGAT, Searin, Graphic: Green World Foundation Dams Shopping Malls Pak Mun Dam Impacts of Pak Mun Dam alone MBK Siam Paragon Central World")
24
Changing energy intensity over 20-yr period Data source: Energy Information Administration 2008

25
Office of the National Economic and Social Development Board O F F I C E O F T H E P R I M E M I N I S T E R Low Quality Education Low Quality labour Insufficient in R&D Investment Slow Technology Development Low Quality for Raw-material, machinery and equipment (Low margin/return) Low Basic infrastructure and Logistic development Enabling factors: MACROECONOMIC MANAGEMENT No immunity/ High volatility Financial System Lack of Saving Lack of regulation on industrial product’s quality control Low Value Creation High Import Contents & Sheer size of export to GDP High Energy Intensity & Low Efficiency & Unsustainable structure Macroeconomic Analysis
 Low Basic infrastructure and Logistic development Enabling factors: MACROECONOMIC MANAGEMENT No immunity/ High volatility Financial System Lack of Saving Lack of regulation on industrial product’s quality control Low Value Creation High Import Contents & Sheer size of export to GDP High Energy Intensity & Low Efficiency & Unsustainable structure Macroeconomic Analysis")
26
Thailand’s power sector: sustainable economic development? Evident economic, material development… …but not sustainable – Needs to rely on ever-increasing energy imports – Vulnerability to supply disruptions due to high level of centralization Unproductive, inefficient consumption only made possible by borrowing from the past (plundering resources) and the future (debt to be repaid) – Government debt now >40% of GDP – Household debt at 20-23% of income, to rise to 40%
 and the future (debt to be repaid) – Government debt now >40% of GDP – Household debt at 20-23% of income, to rise to 40%.")
27
Thailand’s economic, power sector growth Sustainable or quality economic, social development Energy obesity from unhealthy consumption habits that are financed by debt ≠

28
Is there a better way? Yes! (Full report available for download at www.palangthai.org)

29
Not all energy demand/GDP $$$ are equal: some industries have high energy, environmental costs but low value to economy BOI investment privileges should take into account energy, economic value considerations High energy intensity Low value added Low competitiveness Iron smelter industry Demand for electricity is not a given. We can choose wisely what kind of industries or economic activities are worth supporting (e.g. given investment privileges) based on their energy, environmental costs and value to economy (local job creation, local content, value creation)
 based on their energy, environmental costs and value to economy (local job creation, local content, value creation).")
30
Government Policy Framework according to Energy Industry Act 2007 4 dimensions of energy security Energy Industry Act 2007Indicators Availability- Resource Adequacy - Min. dependency on imports - Diversification - Reserve margin ≥15% - % energy imports -Shares of fuels Affordability- Affordable cost of service - Min. exposure to price volatility - Electricity cost (B/mo.) - % exposure to oil price Efficiency- Energy & economic efficiency- Energy intensity (GWh/GDP) Environment- Min. environmental impacts- GHG emissions - SO2 emissions Need to make “energy security” and PDP accountable to government policy framework Need to make “energy security” and PDP accountable to government policy framework Framework for evaluating PDPs
 - % exposure to oil price Efficiency- Energy & economic efficiency- Energy intensity (GWh/GDP) Environment- Min. environmental impacts- GHG emissions - SO2 emissions Need to make energy security and PDP accountable to government policy framework Need to make energy security and PDP accountable to government policy framework Framework for evaluating PDPs.")
31
Insulate roofs to keep cool in T-5 Prioritize energy efficiency (least-cost supply options)
")
32
Prioritize decentralized generation over centralized options: Cogeneration (Combined Heat and Power – CHP)
")
33
Comparing PDPs

34
Dependency on electricity/fuel imports

35
Cost of service (Baht/month) change in 2030 compared to 2010
 change in 2030 compared to 2010")
36
Emissions of air pollutants change in 2030 compared to 2010

37
Comparing PDPs against different elements of energy security change in 2030 compared to 2010 (Negative value = improved elements of energy security)
")
38
Best practices from international experience Case study of Pacific Northwest, USA (incl. Washington State) & Integrated Resource Planning (IRP) process
 & Integrated Resource Planning (IRP) process.")
39
Objectives Defined Data collection, systems analysis Demand forecast scenarios (by end use) Meeting electricity requirement: options END-USE EFFICIENCY IMPROVEMENTS T&D IMPROVEMENTS GENERATION PLANTS UNIT COSTS OF ALTERNATIVES ($ / kWh) LEAST COST MIX ITERATION GWh YEAR $/kWh GWh Strategies Implementation Periodic Monitoring C B A IRP Flowchart Source: D’Sa, A. (2005). "Integrated resource planning (IRP) and power sector reform in developing countries." Energy Policy 33(10): 1271-1285.
. Integrated resource planning (IRP) and power sector reform in developing countries. Energy Policy 33(10):")
40
Northwest Power and Conservation Council slide 40 Resource Costs: fair, comprehensive cost comparison Source Northwest Power and Conservation Council, 6th Plan.

41
Northwest Power and Conservation Council slide 41 6 th Plan Resource Portfolio* * Expected Value Build Out. Actual build out schedule depends on future conditions Source Northwest Power and Conservation Council, 6th Plan.

42
Xayaburi dam vs. RE or EE investment Economic Multiplier Effect Source: US Department of Energy, The Jobs Connection: Energy Use and Local Economic Development, http://www.localenergy.org/pdfs/Document%20Library/The%20Jobs%20Connection.pdf Accessed March 8, 2013. http://www.localenergy.org/pdfs/Document%20Library/The%20Jobs%20Connection.pdf The economic multiplier, also known as the multiplier effect, is a measure of how much economic activity can be generated in a community by different combinations of purchasing and investment.

43
Lessons for Myanmar The engine of sustainable economic & social development Environment People (peace, democracy, justice) Improved living standards & economic opportunity: -Wealth generation -Access to electricity -Education -Health Electricity
 Improved living standards & economic opportunity: -Wealth generation -Access to electricity -Education -Health Electricity")
44
Large Plants Customers Small Power Producer Mini-Grid Customers Parallel approach: extending the grid and encouraging rural mini-grids National Grid Top-downBottom-up

45
Special considerations for Myanmar “The last frontier” How to leverage external resources while maximizing benefits to the locals and without losing sovereign power How to generate income while having sufficient resources to sustainably meet growing domestic needs

46
Strategy for Myanmar’s power sector planning, policy and development Integrated economic and energy policy and planning – Minimize waste, maximize efficiency – Choose economic activities wisely: low energy & resource intensity, high economic value, high competitiveness – Maximize economic value for each energy investment: “getting the most bang (jobs, investments, purchasing) for the $$$ invested” Prioritize utilization of distributed renewable over non-renewable resources Empower participation by citizens, entrepreneurs and communities in power sector planning and development
 for the $$$ invested Prioritize utilization of distributed renewable over non-renewable resources Empower participation by citizens, entrepreneurs and communities in power sector planning and development")
47
Thank you Questions and discussion Email: chom at palangthai dot org www.palangthai.org

48
Large Plants Customers Small Power Producer Mini-Grid Customers Parallel approach: extending the grid and encouraging rural mini-grids National Grid

49
Power export $ Donor funds $ Electrification Fund Regulatory framework allows for fair treatment of both

51
Centralized energy is also more costly Thailand PDP 2007 requires 2 trillion baht to implement, comprising: million B generation 1,482,000 transmission 595,000 Transmission adds 40% to generation costs Decentralized generation brings down costs Ireland – retail costs for new capacity Source: World Alliance for Decentralized Energy, April 2005

52
ROIC = Net profit after tax Invested capital EGAT 6.4% MEA PEA Financial criteria for utilities link profits to investments –Thailand uses outdated return- based regulation –WB’s promoted financial criteria such as self financing ratio (SFR) also have similar effects ROIC (Return on Invested Capital means: the more you invest, the more profits Incentive structure for utilities: the high their investment budget, the more profits 5.8% Result : EGAT favors capital-intensive investments (centralized plants) by its organization or subsidiary companies. Allowing more EE or RE generation hurts EGAT’s bottom line

53
53 Thailand’s Fuel Mix for Power Generation Total Installed Capacity: 31,517 MW (2010)
")
54
Source: Puget Sound Energy

55
Pacific NW: meeting growing demand through mainly investments in RE and EE Northwest Power and Conservation Council Source: Northwest Power and Conservation Council

56
Source: Charles, Gillian and Tom Eckman. 2010. Regional Conservation Progress Report – Results from 2010. Regional Technical Forum. http://www.nwcouncil.org/energy/rtf/consreport/2010/Default.asp http://www.nwcouncil.org/energy/rtf/consreport/2010/Default.asp

57
Cost of new conservation less than $0.02/kWh Source: Charles, Gillian and Tom Eckman. 2010. Regional Conservation Progress Report – Results from 2010. Regional Technical Forum. http://www.nwcouncil.org/energy/rtf/consreport/2010/Default.asphttp://www.nwcouncil.org/energy/rtf/consreport/2010/Default.asp

58
Insulate roofs to keep cool in T-5

59
Source: The 5 th NW Electric Power and ConservationPlan Supply options in NW USA

60
Source: The 5 th NW Electric Power and ConservationPlan Supply options in NW USA

61
Energy waste in a typical pumping system

62
Important conceptual framework Rural electrification ≠ grid expansion Rural electrification = off-/mini-grid + grid expansion Planning for domestic electricity demand (electrification) = Power Development Plan (PDP) process Planning for hydropower export should be treated separately, with consideration of other ways of generating income (e.g. tourism, agriculture, industrial development) as alternatives
 as alternatives.")
63
Power sector development strategy Energy security – Ability to meet demand through sustainable and efficient utilization of resources at reasonable cost Alternative energy development Energy prices and safety Conservation and efficiency Environmental protection

64
Thailand’s experience Emphasis of top-down centralized model Treating demand as given Emphasis on expansion and unsustainable centralized technology options Lack of meaningful participation

65
Strategy Efficient, sustainable utilization of resources – Self-reliance Self-reliance – Efficiency (production and consumption) – Sustainable utilization of natural resources – Value to economy – Leveraging external resources – Role of private sector – Myanmar being “the last frontier”
 – Sustainable utilization of natural resources – Value to economy – Leveraging external resources – Role of private sector – Myanmar being the last frontier")
66
Energy demand is 1.4 times higher than GDP growth Source : EIA,DOE, BP Statistic Review of World Energy, EGAT Energy Elasticity = ∆ t Energy Consumption/ ∆ t GDP Ave. Energy Elasticity 1.4 : 1.0 New Target 1 : 1 or lower Thailand

67
Source: http://doc-eppo.eppo.go.th/key_indicators/elasticity/EE_EI_ELE.ppt

71
ในความเป็นจริง มีความไม่แน่นอนจาก เหตุการณ์ “ ที่ไม่คาดหมาย ” การพยากรณ์ไฟฟ้าหรือเศรษฐกิจมักจะไม่ได้นำเหตุการณ์ “ ที่ไม่ คาดหมาย ” มาพิจารณาเพราะยากแก่การคาดหมาย – ตัวอย่างเช่น วิกฤตการเงินในปี 2540 การพุ่งสูงของราคาน้ำมันโลก ความรุนแรงทางการเมือง และอุทกภัยร้ายแรงในรอบ 50 ปี ในอนาคต ความไม่แน่นอนจากภาวะเศรษฐกิจโลก สถานการณ์ ด้านการเมืองในประเทศ และสภาพภูมิอากาศที่แปรปรวน คาด ว่าจะยังมีอยู่ต่อไป

72
Comparison of trend lines with historical peak consumption Exponential Linear Past demand trajectory was linear but how come the official demand projections have always assumed exponential trend and over-estimated?

73
Source: Energy for Environment Foundation, Study Project for Load Forecast – Executive Summary.

79
Needed: bottom up forecasts Thailand should invest in load forecasts that use a bottom-up approach using industry-specific and sector-specific data on: – electricity demand trends – technology transitions trends

Similar presentations


 April 2009 1.>")


, Medium - and Long – term Investment Plan and the Role of the Private Sector Mr. Rangsan Sarochawikasit.>")

