Download presentation
Presentation is loading. Please wait.

1
Mapping El-Niño

2
A Production of Oregon Sea Grant Department of Marine Education © 1998 by Oregon Sea Grant All Rights Reserved

3
Greetings Greetings Welcome to the Mapping El-Niño workshop. My name is Ron Crouse. I am the Marine Educator for Oregon State University’s Hatfield Marine Science Center in Newport, Oregon. I first heard of El-Niño in 1976 and have been following the scientific community’s study of this phenomenon ever since. With all the recent coverage of El-Niño, I felt that I could benefit science students by designing a hands-on program in which they could actually map the development of the 1997-98 El-Niño event across the equatorial Pacific ocean.

4
Through the use of NOAA’s computer models of sea surface temperature recorded by the Tropical Atmosphere Ocean Buoy Array (TAO), moored in the equatorial Pacific ocean, I developed this program which I hope will assist students in the skills of map reading, data assimilation, graphing anomalies and provide a basic understanding of an El-Niño event and how scientists study and measure our changing oceans. I hope that teachers and students alike will have as much fun with this program as I had in designing it and putting it together for your classes.

5
Class Overview The class itself will be presented in two parts. During the first half of this class we will: review the resources available to scientists for studying the ocean, primarily the TAO Buoy Array introduce NOAA’s computer models of sea surface temperature and learn how to read sea surface temperature maps understand how and why anomaly maps are necessary to visualize changing ocean conditions prepare and present the activity where students can actually create anomaly maps of the 1997-98 El-Niño

6
During the second half of this class we will: present the “answers” so that students can grade their work against the actual NOAA sea surface temperature anomaly maps present graphics illustrating the difference between “normal” ocean conditions and those found during an El-Niño event introduce ways that El-Niño impacts conditions in the Pacific ocean as well as around the globe If you have any questions, comments or suggestions during the course of this workshop, feel free to contact me at (541)867-0326 or e-mail at: crouser@ucs.orst.edu
 or at:")
7
Goals, Objectives and Benchmarks During this classroom learning experience you will have the opportunity to study the development of an unusual ocean event, termed “El-Niño.” This warming of tropical ocean waters has been observed and noted by Peruvian fishermen since the 1500’s. Thanks to the establishment of global weather tracking systems, the mysteries of El-Niño are just beginning to unfold. Our objective in offering this class is to provide a hands-on exercise that gives students the ability to effectively visualize the development of an El-Niño, how it occurs, and its effect on Pacific ecosystems.

8
Our Goals for this class are: Provide the student with an understanding of how oceanographers measure present ocean conditions Understand the principles of and be able to determine latitude and longitude To be able to read NOAA’s computer generated Sea Surface Temperature maps and the contours of isotherms and gather data from them Understand the differences between “normal” ocean conditions and present “real-time” ocean conditions Compare the data and map the anomalies (differences) in color to produce monthly maps exposing the El-Niño event Follow the development of the 1997-98 El-Niño event, learning how it occurs, its impact on ocean conditions, and subsequent effects on marine food chains
 in color to produce monthly maps exposing the El-Niño event Follow the development of the El-Niño event, learning how it occurs, its impact on ocean conditions, and subsequent effects on marine food chains")
9
Oregon Education Common Curriculum Goals and Benchmarks Curriculum Goal: Use analysis and interpretation to formulate explanations and draw reasonable conclusions based on the results of an investigation. Use integrated scientific process skills to predict, design experiments, control variables, interpret data, define operations and formulate models. Grade 8 Benchmark--Evaluate evidence of physical and biological changes over time. Use a model to make predictions and inferences about familiar and unfamiliar phenomena in the natural world. Grade 10 Benchmark--Use conceptual and/or mathematical models to explain natural systems. Propose explanations that are supported by data and knowledge of science concepts and principles. Grade 12 Benchmark--Design and conduct a scientific investigation based on questions or hypotheses related to a current issue. Analyze data collected in a scientific investigation on a current problem or issue and evaluate sources of error and/or bias.

10
Measuring the Oceans Scientists use many techniques to measure our oceans. Data from numerous sources are combined by computers to give us graphic images of the changing ocean conditions. Some of these include: Moored Buoys Tide Gage Stations Satellite Data Relay Drifting Buoys Volunteer Observing Ships

11
TAO Buoy Array Tropical Atmosphere Ocean Array Tropical Atmosphere Ocean Array The TAO array, consisting of approximately 70 moored ocean buoys in the Tropical Pacific Ocean, measures ocean and atmosphere conditions. Supported by countries worldwide, it is a major component of the global climate monitoring system.

12
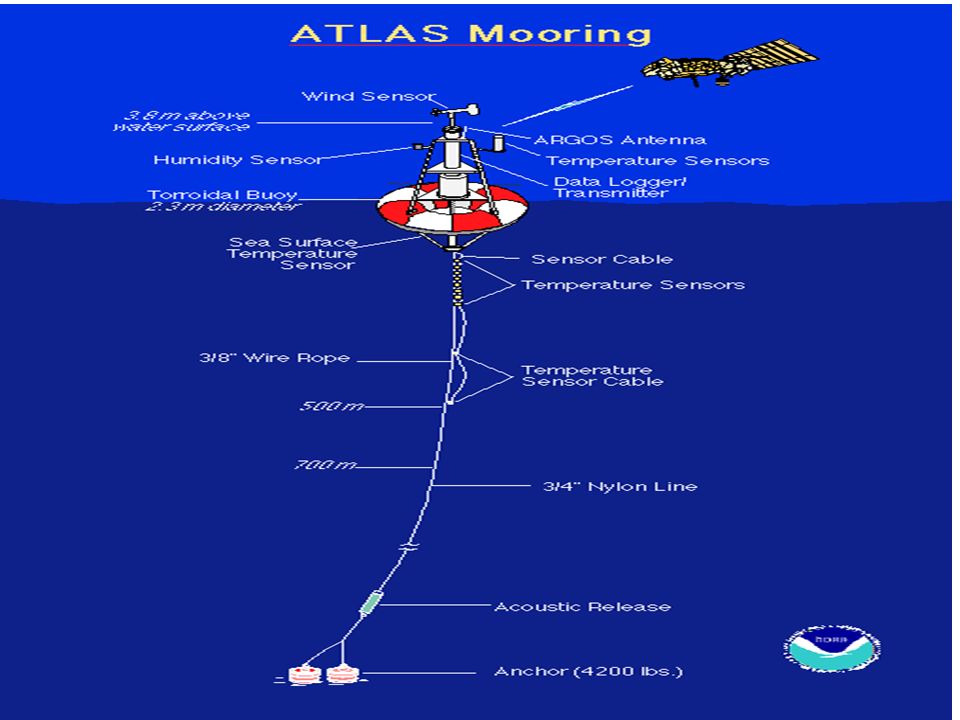
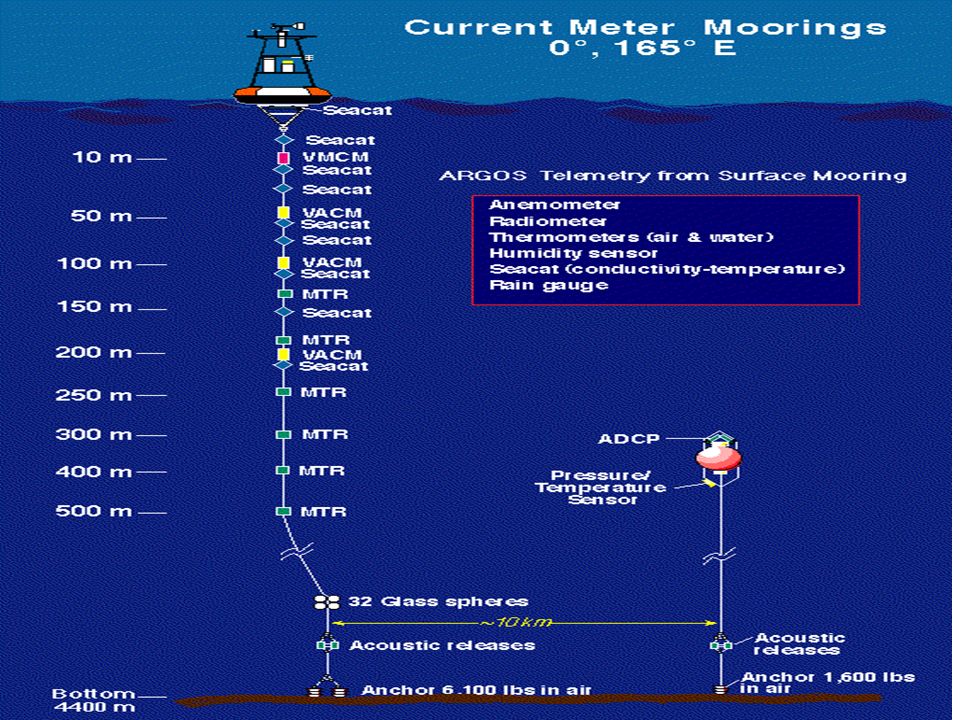
The Buoy System There are two types of buoys used in the TAO Array ATLAS buoys measure surface winds, air temperature, and relative humidity, and ocean temperatures in the upper 500 meters. Equatorial Current Meter buoys include additional instruments to measure ocean currents and other parameters, such as short- wave radiation, and rainfall.

15
Data Relay

16
Creating Computer Models Goals of this lab –Understand how scientists gather ocean data –Utilize computer models to determine SST anomalies –Create anomaly maps and plot an El-Niño event

17
Definitions SSTSST –Sea surface temperature, measured at one meter below the surface AnomalyAnomaly –The difference between the current SST value and its long term average IsothermIsotherm –A line on a map connecting points having the same temperature for a given period of time

18
Monthly Mean SST These maps are generated by computers utilizing the data collected from the TAO Buoy Array. This map shows real-time SST’s (sea surface temperatures) in 0.5°C isotherms It is produced by mapping the mean, or average SST’s for a certain month, in this case January 1997
 in 0.5°C isotherms It is produced by mapping the mean, or average SST’s for a certain month, in this case January")
19
SST Climatologies SST Climatologies show the projected “normal” sea surface temperatures in 0.5°C isotherms These maps indicate what we would expect the ocean SST’s to be during a “normal” month, in this case, January Anomalies are found by subtracting the “normal” SST from the real-time SST

20
SST Anomalies Once all the SST anomalies, or differences from “normal” are plotted, the computer generates a map indicating how the average SST’s for January 1997 differed from the “normal”. In this case the equatorial Pacific ocean appears relatively normal, no El-Niño event is visible.

21
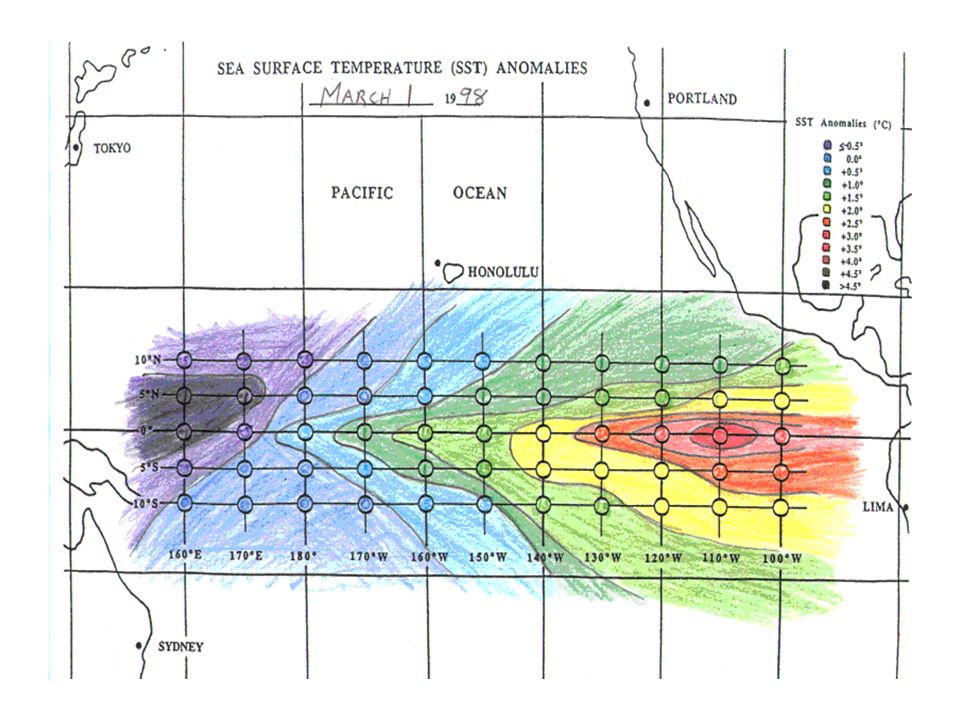
El-Niño SST Anomalies When we plot the anomalies and create an SST map during an El-Niño month we see a big difference in the equatorial Pacific ocean conditions. The isotherms indicate that there are temperature anomalies ranging from -0.5°C in the upper left corner to +4.5°C in the right center. Only by mapping SST anomalies in this way can we visualize the occurrence of an El-Niño event.

22
Procedures for Mapping El-Niño Collect SST data from climatology and real-time NOAA maps Determine real-time SST anomalies (variation from the normal SST) Plot the SST anomalies and create an anomaly map Follow the development of El-Niño in the equatorial Pacific Ocean
 Plot the SST anomalies and create an anomaly map Follow the development of El-Niño in the equatorial Pacific Ocean")
23
List of Materials Black-and-white or color monthly map sets Rulers or straight-edges long enough to extend the length of the maps Pacific Ocean worksheets enlarged to 11”x17”(extras are recommended) Package of twelve colored pencils in an appropriate color spectrum and labeled with readings from Š-0.5°C to >+4.5C° in 0.5°C increments Pocket calculator (optional), scratch paper, pencils and erasers
 Package of twelve colored pencils in an appropriate color spectrum and labeled with readings from Š-0.5°C to >+4.5C° in 0.5°C increments Pocket calculator (optional), scratch paper, pencils and erasers")
24
Step #1 Identify TAO Buoy Locations We will be determining the SST anomaly value for each approximate TAO Buoy location. In this case we will assume that a buoy is moored at the intersection of every 10° longitude and 5° latitude We will also assume that our array spans between 160°W and 100°E longitude and 10°N and 10°S latitude

25
Pacific Ocean Worksheet The buoy locations (indicated by circles on the above map) relate directly to those indicated on your Pacific Ocean Worksheet Your job is to determine and fill-in the SST anomaly values, or difference from “normal, for each location in the TAO Buoy Array.
 relate directly to those indicated on your Pacific Ocean Worksheet Your job is to determine and fill-in the SST anomaly values, or difference from normal, for each location in the TAO Buoy Array.")
26
Step #2 - Determine SST Values at each TAO Buoy location You will find a set of TAO maps following these directions. Each page contains a one month SST mean map on top and its corresponding one month climatology map on the bottom.

27
Determine Real-time SST Begin with your TAO Monthly Mean SST map Draw latitude lines every 5° from 10°N to 10°S (ie Blue lines on the above map) Draw longitude lines every 10° from 160°E to 100°W Determine SST value at each intersection, or buoy location As with all scientific procedures, you may find gaps in the data. Using your best judgment, extend out the isotherms and make your best guess.

28
Determine Normal SST Using your Climatology map, repeat drawing latitude and longitude lines Determine SST value at each intersection Determine your SST anomaly value for each intersection by subtracting the normal from the real-time (this can be a positive or negative value, or a zero value)
")
29
Helpful Hints Realize that the maps have been adjusted to be equal in scale, however the colors in the Monthly Mean maps do not quite relate to the same temperatures as they do in the climatology maps. It is recommended that you print your set of monthly maps in a gray scale if you do not have color printer capabilities. You can then draw your latitude- longitude lines on your worksheets and check any questionable values against the display on your color monitor. As with most computer generated maps, the numbers are not always easy to read. Be sure to go slow and double check all your SST readings for each buoy location

30
Step #3 Develop your own SST Anomaly Map On the following page you will find the full-size version of your Pacific ocean worksheet. You can print it and enlarge it by 150% onto a 11”x 17” sheet for easier work. Fill-in the legend and the anomaly reading you have determined for each location with the appropriate color pencil Draw-in the isotherms to produce a color version of your SST Anomaly map

31
Pacific Ocean Worksheet

32
Helpful Hints When drawing in the isotherms remember that due to quick changes in ocean SST’s in some locations the isotherms will be very close together. You need to think ahead in order to get several 0.5°C isotherms in between adjacent buoy locations. Once your isotherms are drawn in, you may go back and shade in the appropriate color for each temperature range. On the next page you will find an SST Anomaly map that I have prepared for your review featuring the average SST Anomalies for March 1, 1998

34
The Answers What would be the fun of a mapping activity if you could not grade your work against the answers? On March 18 we will post the actual TAO Buoy Array SST Anomaly maps generated by the NOAA computers so that you may see how well you did at reading, comparing and mapping the data. We will also provide some further graphics comparing normal ocean conditions with those found during an El-Niño event so you may better understand what your anomaly maps are showing you.

35
GOOD LUCK!

36
Monthly Mean SST’s & Climatologies These are the map sets that you will want to copy. I suggest enlarging them to fit on an 11”x 17” sheet. There are sets from January 1997 through February 1998. I recommend having students work in groups of two or more. The 1997-98 El-Niño event was initially detected in April 1997. Before then, ocean SST conditions were near normal.

37
January 1997

38
February 1997

39
March 1997

40
April 1997

41
May 1997

42
June 1997

43
July 1997

44
August 1997

45
September 1997

46
October 1997

47
November 1997

48
December 1997

49
January 1998

50
February 1998

Similar presentations


 Ernesto R. Verceles PAGASA.>")


