Download presentation
Presentation is loading. Please wait.

1
Describing Location in a Distribution Chapter 2

2
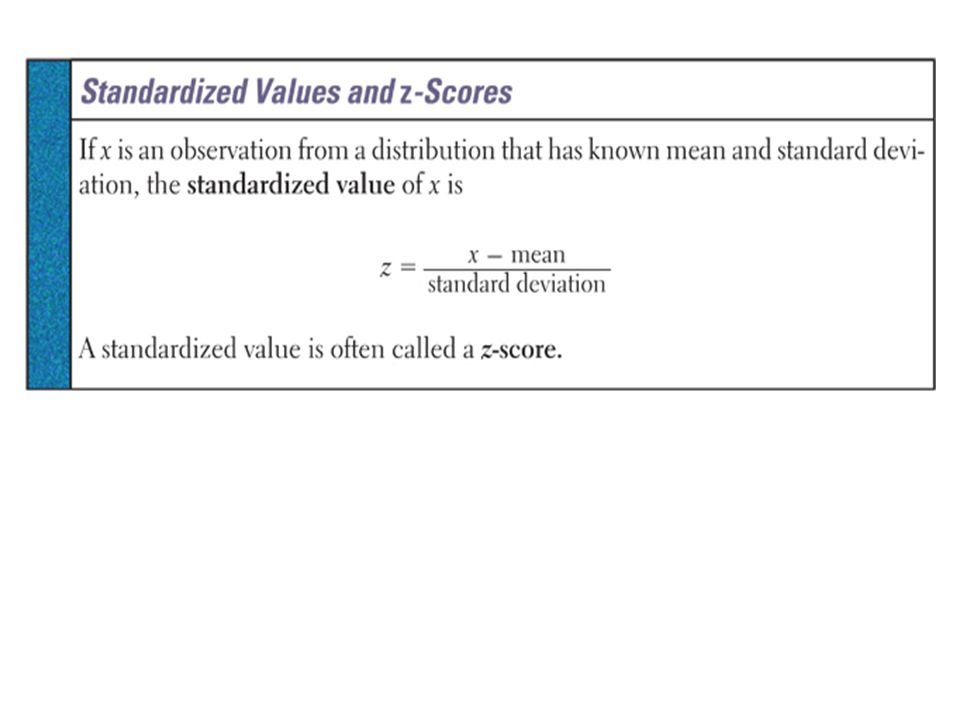
1.Explain what is meant by a standardized value. 2. Compute the z-score of an observation given the mean and standard deviation of distribution. 3.Compute the p th percentile of an observation.

3
Who is taller Tyler or Chloe?

4
Who is taller Tyler or Chloe in terms of gender?

7
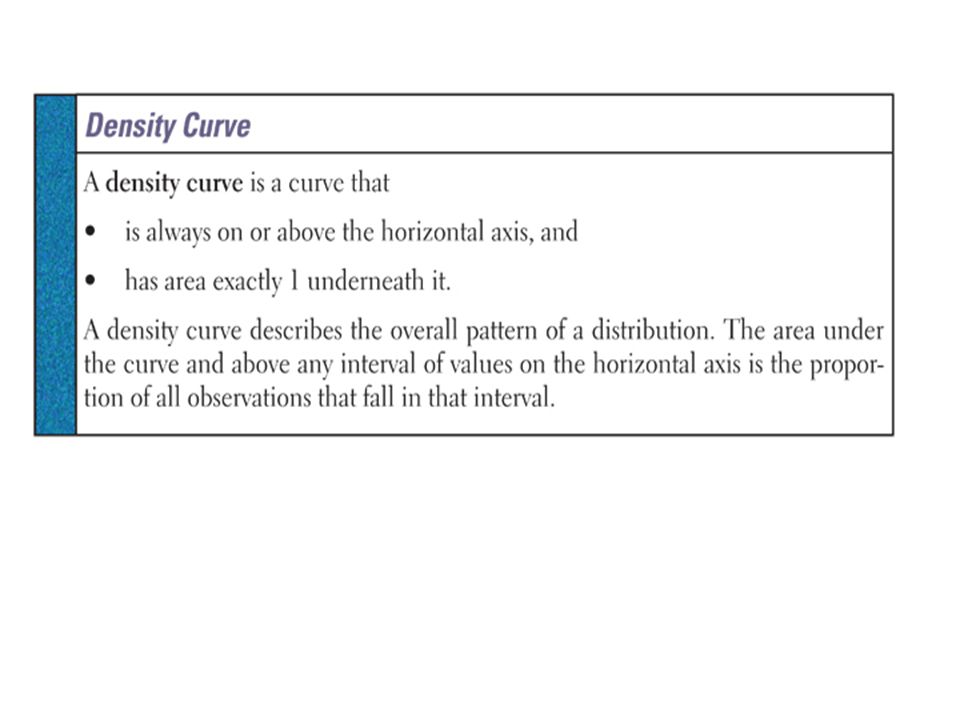
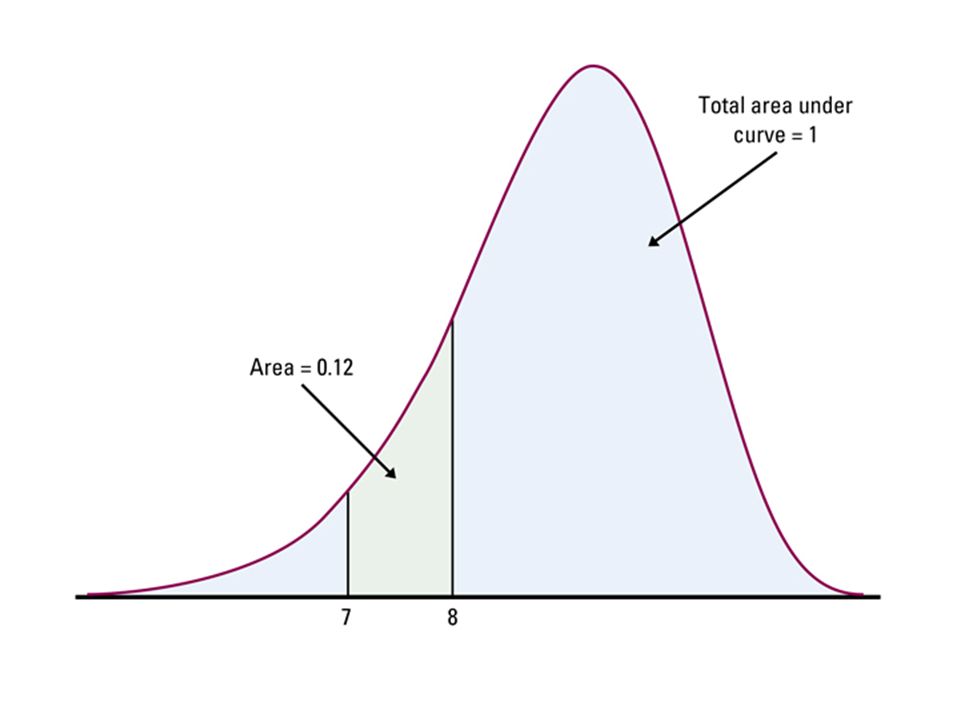
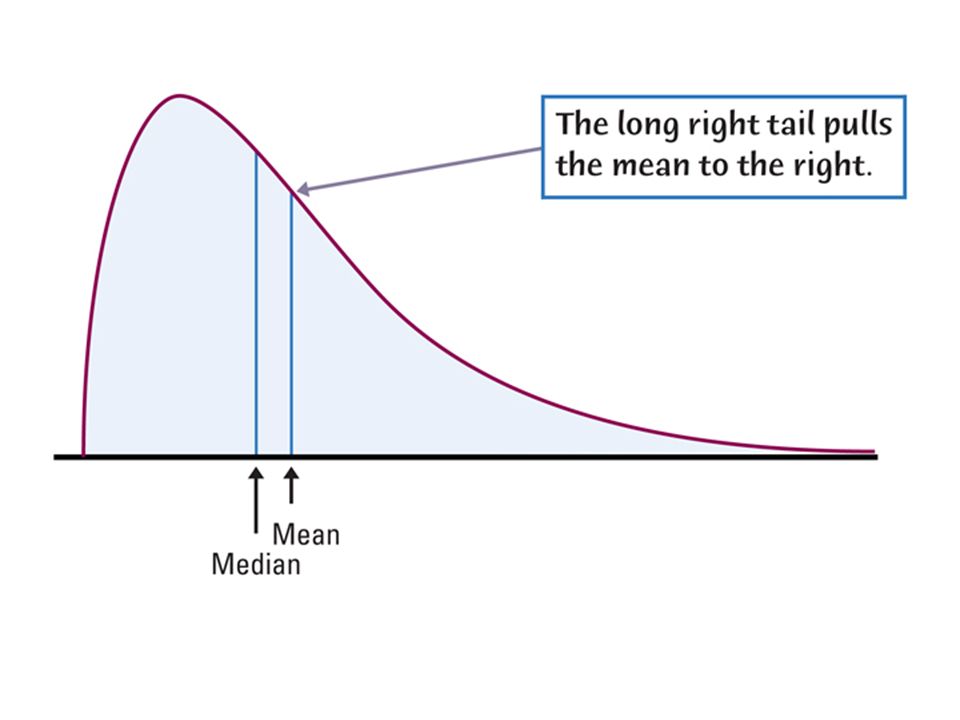
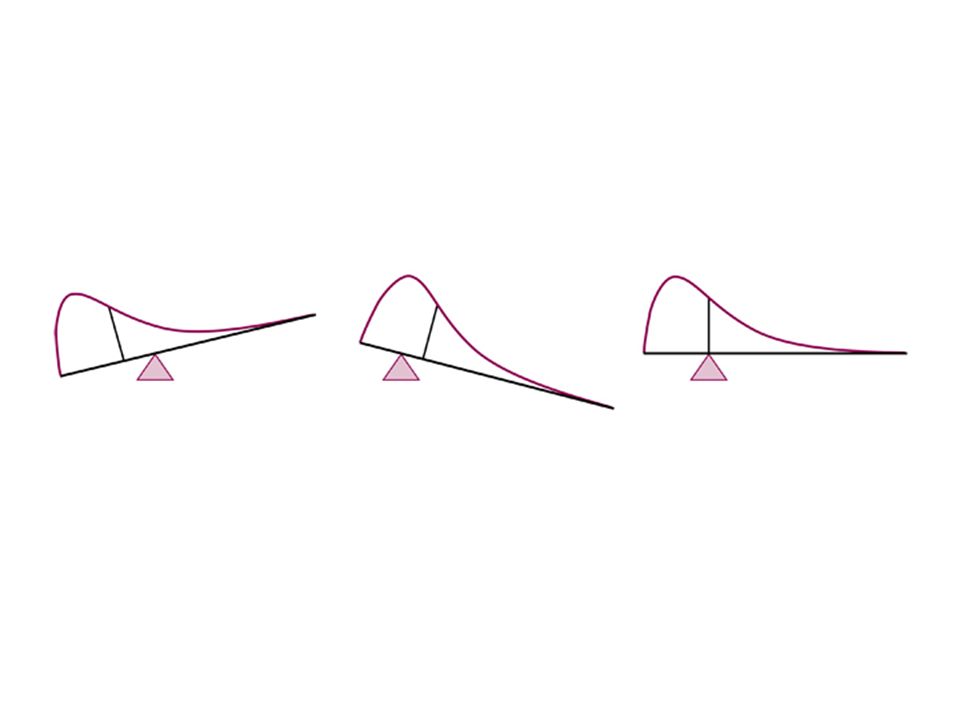
Objectives, Oct. 13, 2014 1.Explain what is meant by a mathematical model. 2. Define a density curve. 3. Explain where the mean and median of a density curve are to be found. 4. Describe the relative position of the mean and median in a symmetric density curve and in a skewed density curve.

9
Histogram of vocabulary scores.

18
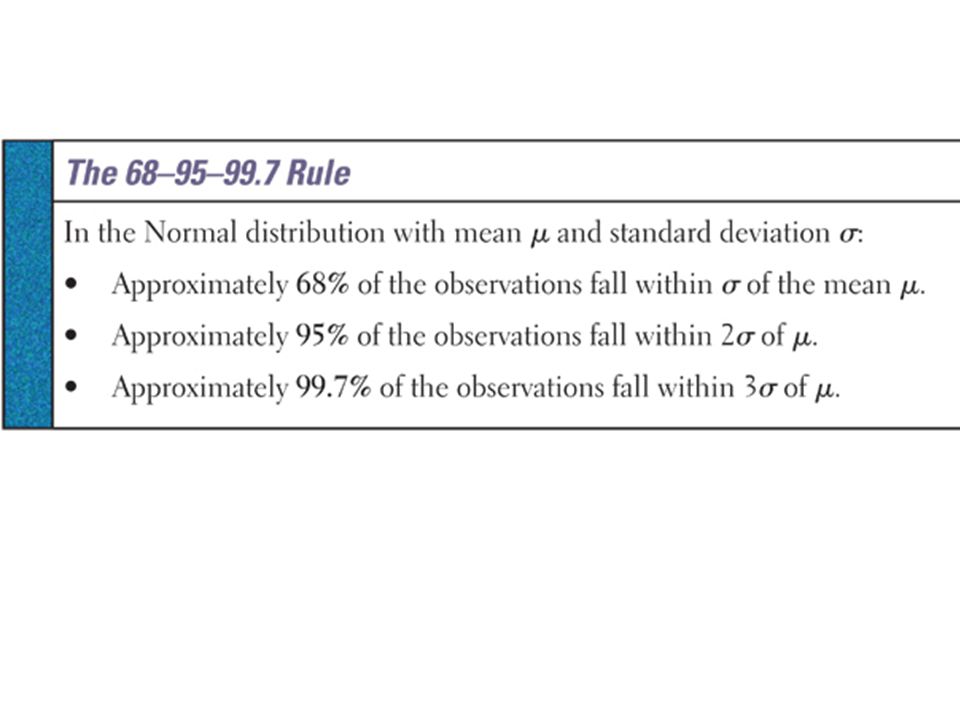
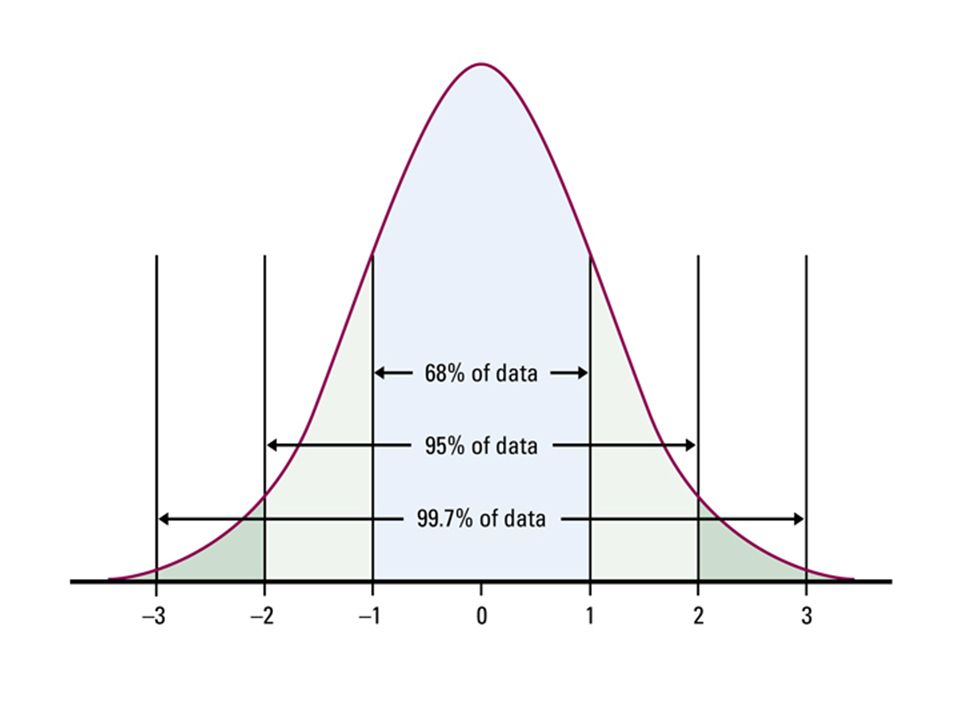
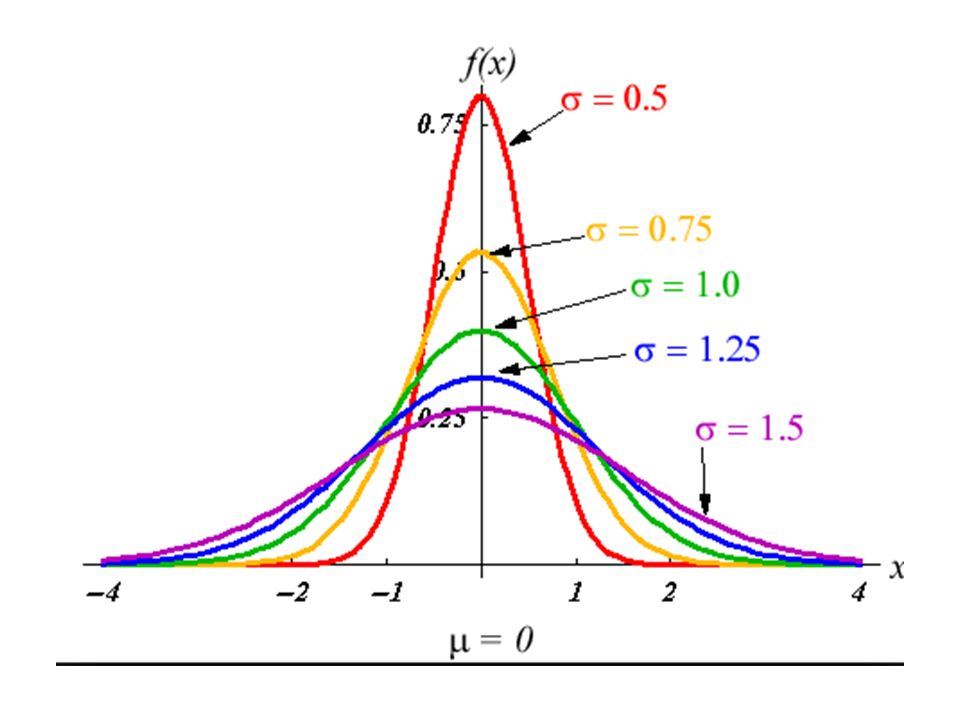
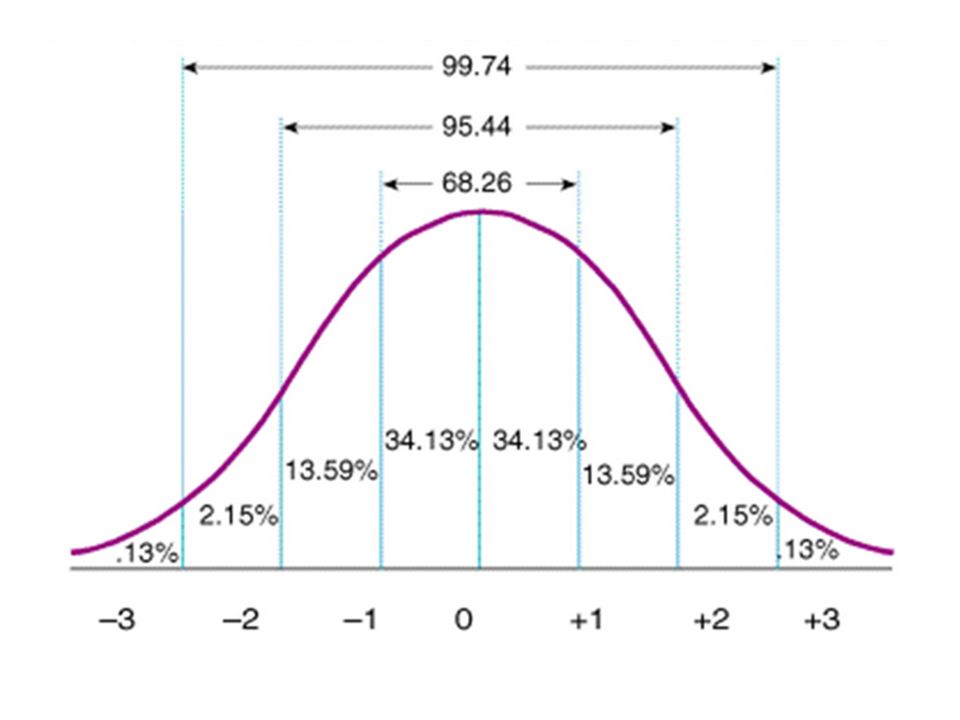
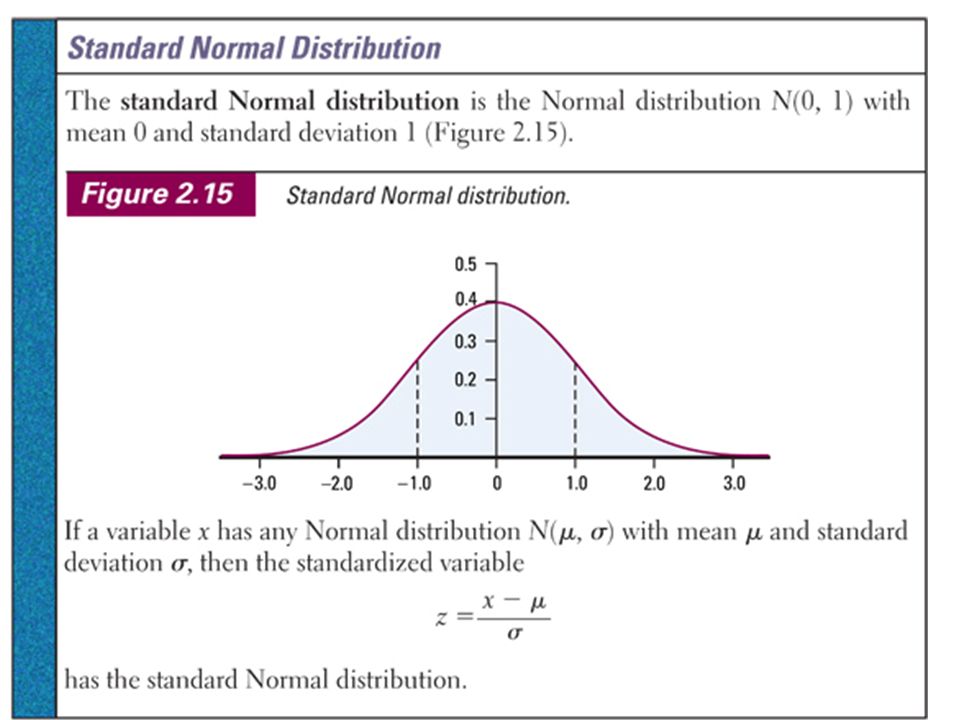
October 14, 2014 Objectives: Identify the main properties of the Normal Curves as a particular density curve. List three reasons why Normal distributions are important in statistics. Explain the 68-95-99.7 rule. Explain the notation N(μ,σ).
..")
27
A study of elite distance runners found a mean body weight of 63.1 kilograms (kg), with a standard deviation of 4.8 kg. (a) Assuming that the distribution of weights is Normal, make an accurate sketch of the weight distribution with the horizontal axis marked in kilograms. (b) Use the 68–95–99.7 rule to find the proportion of runners whose body weight is between 48.7 and 67.9 kg. Show your method. (c) Calculate and interpret the 45th percentile of the runners’ body weight distribution.
 Assuming that the distribution of weights is Normal, make an accurate sketch of the weight distribution with the horizontal axis marked in kilograms. (b) Use the 68–95–99.7 rule to find the proportion of runners whose body weight is between 48.7 and 67.9 kg. Show your method. (c) Calculate and interpret the 45th percentile of the runners’ body weight distribution..")
28
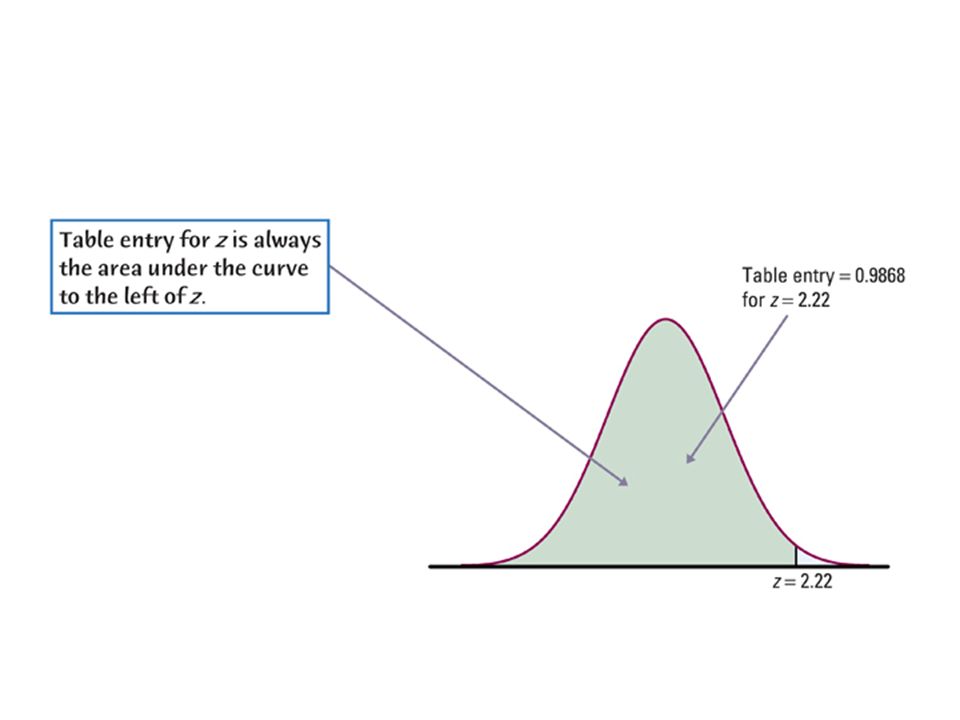
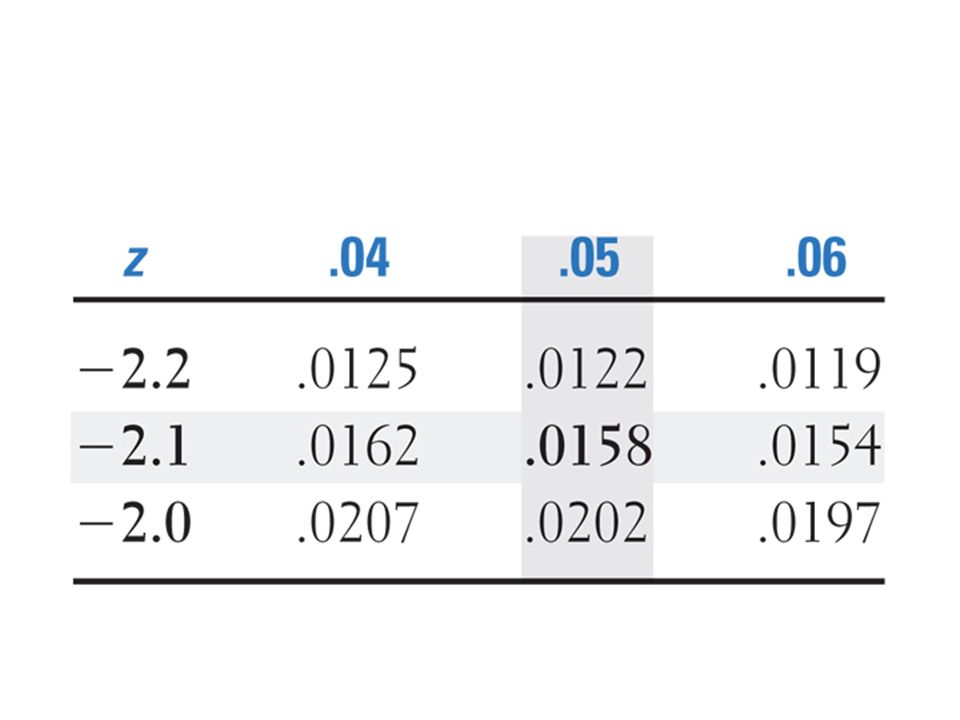
October 16, 2014 Use a table of values for the standard Normal curve (Table A) to compare the proportion of observations that are less than a given z-score, greater than a given z-score, or between two given z- scores. Use a table of values for the standard Normal curve to find the proportion of observations in any region given any Normal distribution. Use a table of values for the standard Normal curve to find a value with a given proportion of observations below or above it (inverse normal).
..")
33
A study of elite distance runners found a mean body weight of 63.1 kilograms (kg), with a standard deviation of 4.8 kg. (a) Assuming that the distribution of weights is Normal, make an accurate sketch of the weight distribution with the horizontal axis marked in kilograms. (b) Use the 68–95–99.7 rule to find the proportion of runners whose body weight is between 48.7 and 67.9 kg. Show your method. (c) Calculate and interpret the 45th percentile of the runners’ body weight distribution.
 Assuming that the distribution of weights is Normal, make an accurate sketch of the weight distribution with the horizontal axis marked in kilograms. (b) Use the 68–95–99.7 rule to find the proportion of runners whose body weight is between 48.7 and 67.9 kg. Show your method. (c) Calculate and interpret the 45th percentile of the runners’ body weight distribution..")
34
Oct. 27, 2014 Objectives: 1.Students will use technology to find the distribution of a data set. 2.Students will determine the normality of a distribution using a normality plot.

Similar presentations