Download presentation
Presentation is loading. Please wait.

1
© T. M. Whitmore TODAY Population Geography of LA Growth Fertility Mortality Age structure Urbanization in LA Spatial patterns Causes & consequences

2
© T. M. Whitmore Population (2007 estimates) Latin America & Caribbean ~ 569 m (8.7% of global total) USA ~ 302 m (4.6 % of global total) World ~ 6,525 m Caribbean ~ 40 m Central America (with Mexico) ~ 148 m Mexico ~ 106.5 m South America (with Brazil ~ 381 m) Brazil ~ 189 m Mexico + Brazil ~ 295.5 m (> ½ of LA; ~ USA)
 Latin America & Caribbean ~ 569 m (8.7% of global total) USA ~ 302 m (4.6 % of global total) World ~ 6,525 m Caribbean ~ 40 m Central America (with Mexico) ~ 148 m Mexico ~ m South America (with Brazil ~ 381 m) Brazil ~ 189 m Mexico + Brazil ~ m (> ½ of LA; ~ USA).")
3
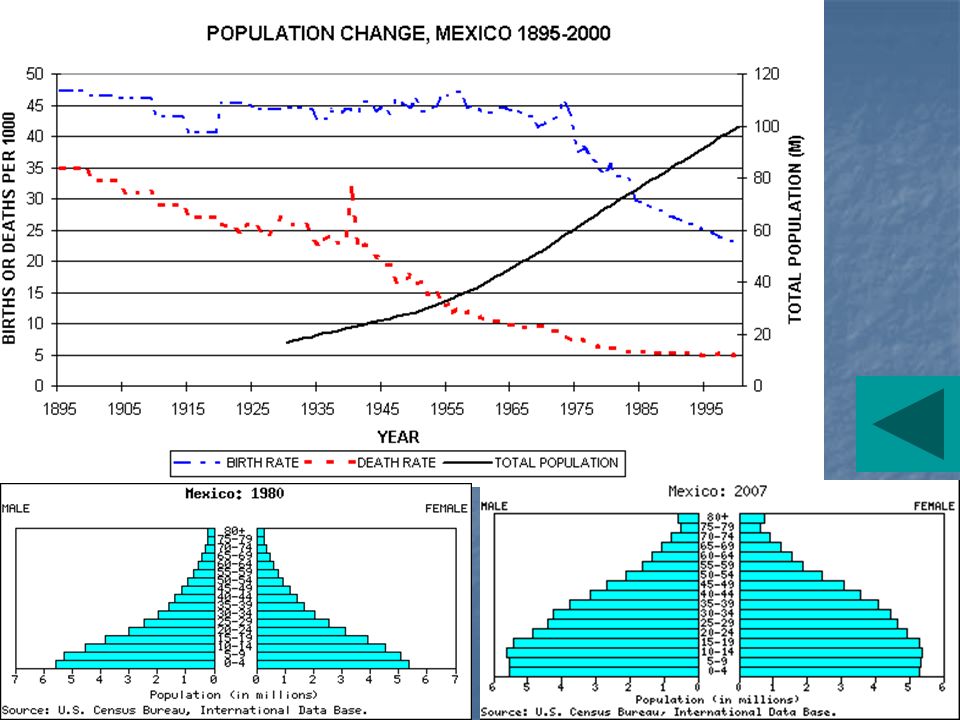
© T. M. Whitmore Demography: Growth related Rate of Natural Increase (RNI) Meaning of “crude” in demography Crude Birth Rate (CBR): live births/1000 pop in a given year Crude Death Rate (CDR): deaths/1000 pop in a given year CBR - CDR = RNI typically given as %/yr assumes no net migration in a given year
 Meaning of crude in demography Crude Birth Rate (CBR): live births/1000 pop in a given year Crude Death Rate (CDR): deaths/1000 pop in a given year CBR - CDR = RNI typically given as %/yr assumes no net migration in a given year.")
4
© T. M. Whitmore Rate of Natural Increase (RNI)/yr Latin America ~ 1.5%/yr USA ~ 0.6%/yr World ~ 1.2%/yr More Developed World ~ 0.1%/yr Lesser developed world ~ 1.5% - 1.8%/yr Historical trends in LA: 1950s - 1980s Declining but less rapidly now
/yr Latin America ~ 1.5%/yr USA ~ 0.6%/yr World ~ 1.2%/yr More Developed World ~ 0.1%/yr Lesser developed world ~ 1.5% - 1.8%/yr Historical trends in LA: 1950s s Declining but less rapidly now.")
5
© T. M. Whitmore Population projections for 2025 Latin America 700 m USA 350 m World 7490 m Caribbean 48 m Mexico 129 m South America 465 m Brazil 229 m Mexico + Brazil 358 m (~ = USA)
.")
6
© T. M. Whitmore Rate of Natural Increase II Caribbean ~ 1.1%/yr Central America (including Mexico) ~ 1.8% Mexico ~ 1.7 %/yr South America (including Brazil) ~ 1.5%/yr Brazil ~ 1.4%/yr Notable extremes HIGH (~ 2.5%/yr): Guatemala, Honduras, Nicaragua, Haiti Bolivia LOW (~ 1%/yr or less): Costa Rica Cuba, Puerto Rico Uruguay, Chile, Argentina
 ~ 1.8% Mexico ~ 1.7 %/yr South America (including Brazil) ~ 1.5%/yr Brazil ~ 1.4%/yr Notable extremes HIGH (~ 2.5%/yr): Guatemala, Honduras, Nicaragua, Haiti Bolivia LOW (~ 1%/yr or less): Costa Rica Cuba, Puerto Rico Uruguay, Chile, Argentina.")
7
© T. M. Whitmore Total Fertility Rate (TFR) = Average total number of births to a woman in her lifetime (superior to CBR) ~ 2.1 => parents only replacing themselves (called replacement level fertility) need the extra 0.1 due to childhood deaths
 = Average total number of births to a woman in her lifetime (superior to CBR) ~ 2.1 => parents only replacing themselves (called replacement level fertility) need the extra 0.1 due to childhood deaths.")
8
© T. M. Whitmore Fertility (TFR) Latin America ~ 2.5 USA ~ 2.1 World ~ 2.7 More Developed World ~ 1.6 Lesser developed world ~ 2.9 - 3.3 Caribbean ~ 2.5 Central America (including Mexico) ~ 2.7 Mexico ~ 2.4 South America (including Brazil) ~ 2.4 Brazil ~ 2.3
 Latin America ~ 2.5 USA ~ 2.1 World ~ 2.7 More Developed World ~ 1.6 Lesser developed world ~ Caribbean ~ 2.5 Central America (including Mexico) ~ 2.7 Mexico ~ 2.4 South America (including Brazil) ~ 2.4 Brazil ~ 2.3.")
9
© T. M. Whitmore Fertility II Notable extremes HIGH (TFR > 3) Guatemala (> 4), Honduras, Nicaragua Haiti (>4.5) Bolivia, Ecuador LOW (< 2.5) Costa Rica, Mexico Cuba, Puerto Rico Uruguay, Brazil, Argentina
 Guatemala (> 4), Honduras, Nicaragua Haiti (>4.5) Bolivia, Ecuador LOW (< 2.5) Costa Rica, Mexico Cuba, Puerto Rico Uruguay, Brazil, Argentina.")
10
© T. M. Whitmore Death related (mortality) Mortality Measured by “life expectancy at birth” (E o )life expectancy at birth = AVERAGE projected span of life at the date for a pop Infant Mortality Rate (IMR)IMR # deaths of infants (< 1yr)/1000 live births in a given yr
 Mortality Measured by life expectancy at birth (E o )life expectancy at birth = AVERAGE projected span of life at the date for a pop Infant Mortality Rate (IMR)IMR # deaths of infants (< 1yr)/1000 live births in a given yr.")
11
© T. M. Whitmore Life expectancy at birth (E o) Latin America ~ 73 yrs USA ~ 78 World ~ 68 More Developed World ~ 77 Lesser developed world ~ 64 – 66 Caribbean ~ 71 Central America (including Mexico) ~ 74 Mexico ~ 75 South America (including Brazil) ~ 72 Brazil ~ 72 Individual extremes
 Latin America ~ 73 yrs USA ~ 78 World ~ 68 More Developed World ~ 77 Lesser developed world ~ 64 – 66 Caribbean ~ 71 Central America (including Mexico) ~ 74 Mexico ~ 75 South America (including Brazil) ~ 72 Brazil ~ 72 Individual extremes.")
12
© T. M. Whitmore Infant Mortality Rate (IMR) Closely correlated with E o & very diagnostic of social underdevelopment and poverty Latin America ~ 24 (per 1000 live births -or 2.9%) USA ~ 6.5 World ~ 52 More Developed World ~ 6.0 Lesser developed world ~ 57 – 61 Caribbean ~ 38 Central America (including Mexico) ~ 23 Mexico ~ 21 South America (including Brazil) ~ 24 Brazil ~ 27 Individual extremes
 Closely correlated with E o & very diagnostic of social underdevelopment and poverty Latin America ~ 24 (per 1000 live births -or 2.9%) USA ~ 6.5 World ~ 52 More Developed World ~ 6.0 Lesser developed world ~ 57 – 61 Caribbean ~ 38 Central America (including Mexico) ~ 23 Mexico ~ 21 South America (including Brazil) ~ 24 Brazil ~ 27 Individual extremes.")
13
© T. M. Whitmore Population age structure - youth Youthful pops: % of pop < 15 years old USA 20% World 28% Lesser developed World 31% - 34% More Developed World ~ 17% Latin America 30% Central America with Mexico 33% Caribbean 28% South America 29% Latin American extremes & consequences

14
© T. M. Whitmore Population age structure - aged Aged pops: (> 65) USA 12% World 7% Lesser developed World 5-6% Latin America 6% Central America with Mexico 5% Caribbean 8% South America 6% Latin American extremes & consequences
 USA 12% World 7% Lesser developed World 5-6% Latin America 6% Central America with Mexico 5% Caribbean 8% South America 6% Latin American extremes & consequences.")
15
© T. M. Whitmore Population age structures Population pyramidpyramid Concept of dependency ratio (pop aged 0-15 + pop aged 65+) *100/ Pop age 15-65 USA dependency ratio 100*(20% +12%)/68% = 47 Developing world dependency ratio 100*(34% + 5%)/61% = 64 Latin America dependency ratio 100*(30% + 6%)/64% = 56
 *100/ Pop age USA dependency ratio 100*(20% +12%)/68% = 47 Developing world dependency ratio 100*(34% + 5%)/61% = 64 Latin America dependency ratio 100*(30% + 6%)/64% = 56.")
16
© T. M. Whitmore

18
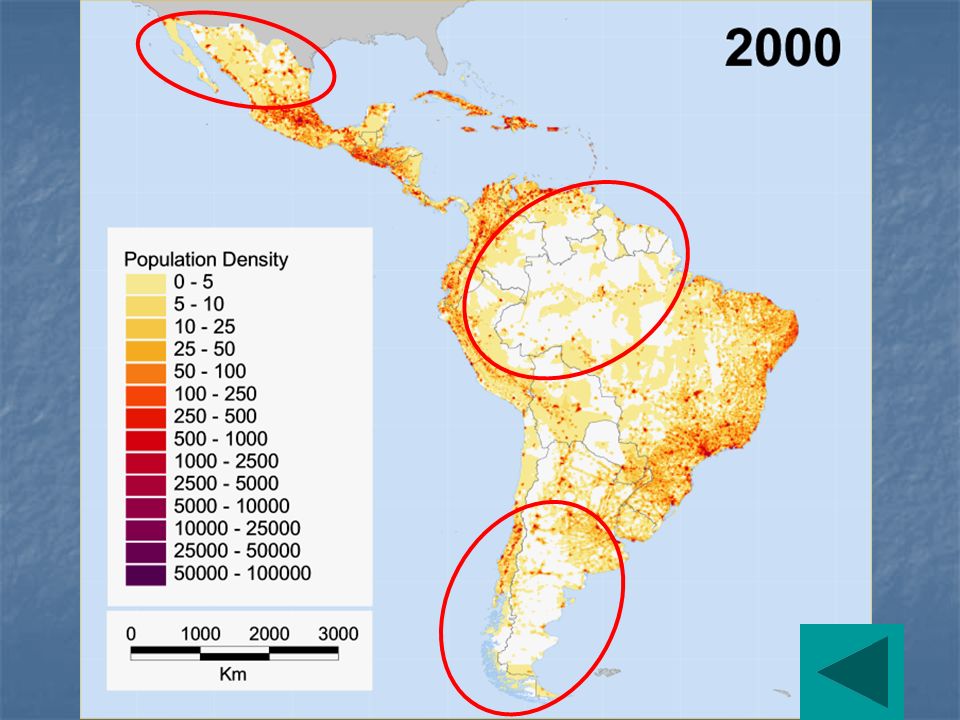
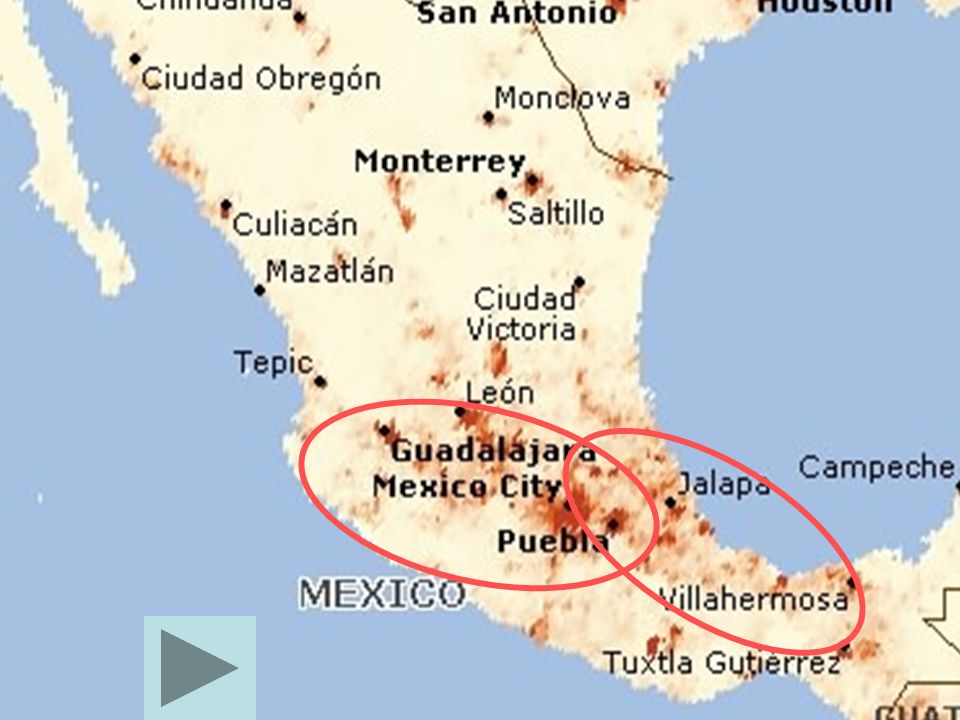
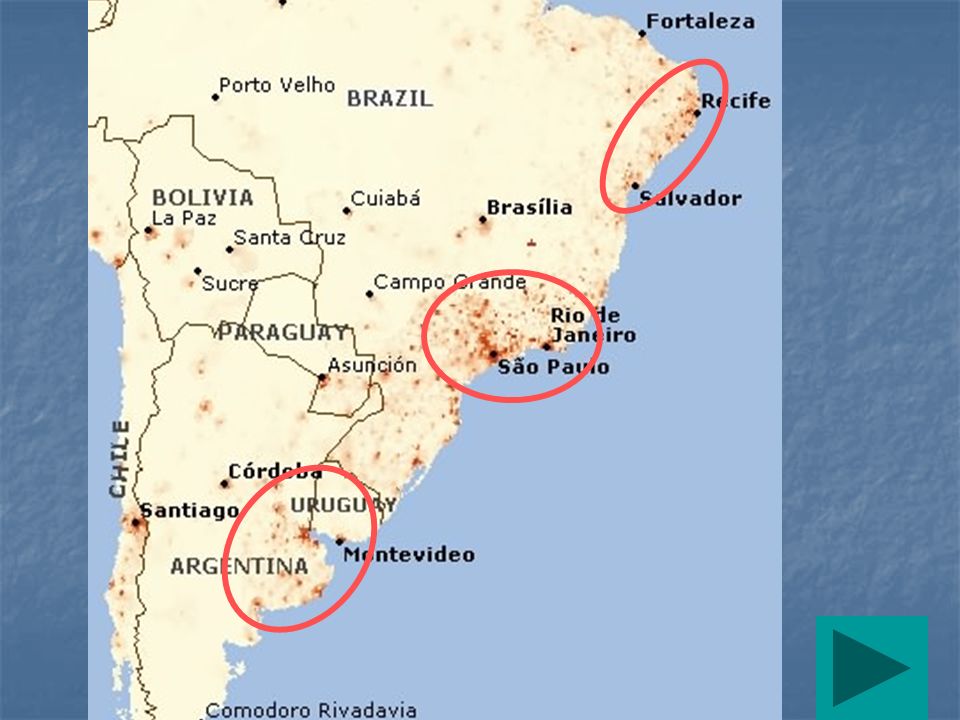
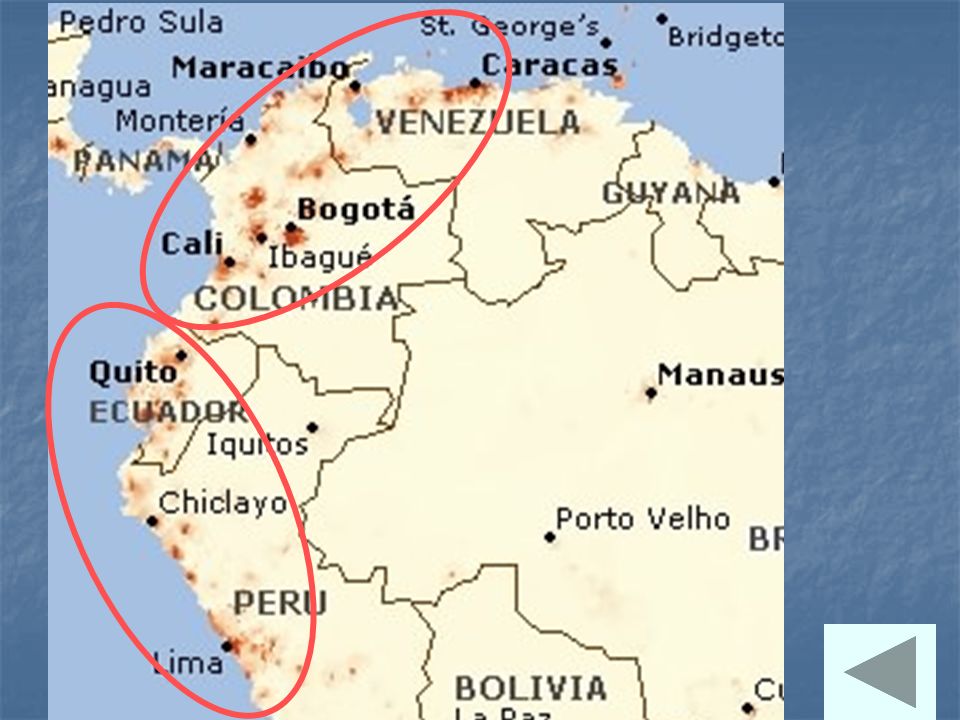
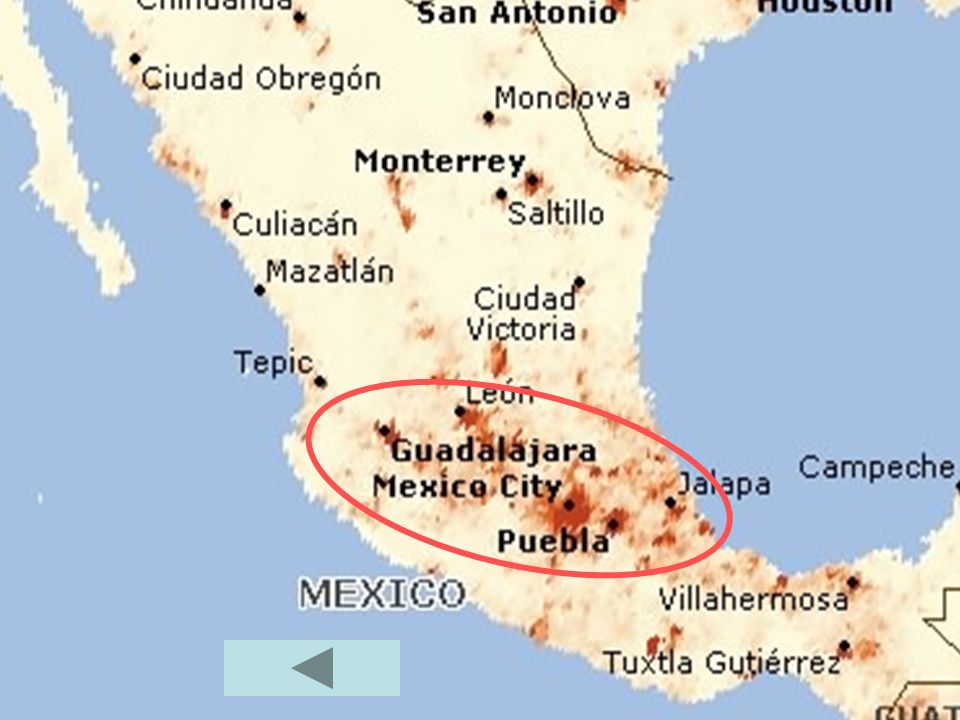
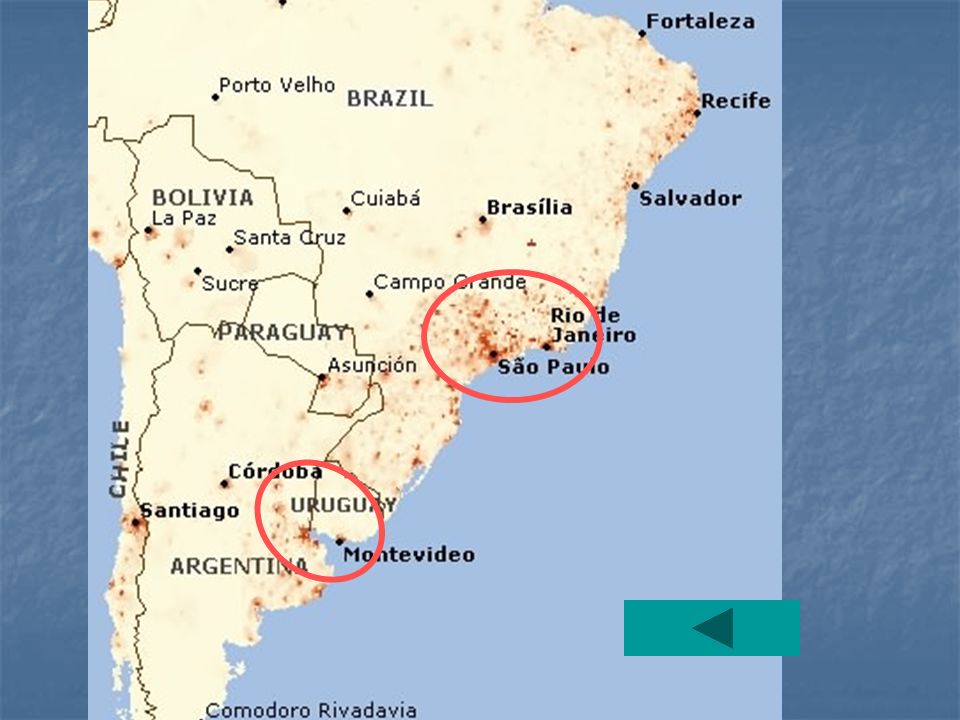
Geographic distribution of population High density zones High Low density zones Low South America’s “empty heart” Arid zones in N Mexico & Southern Cone

19
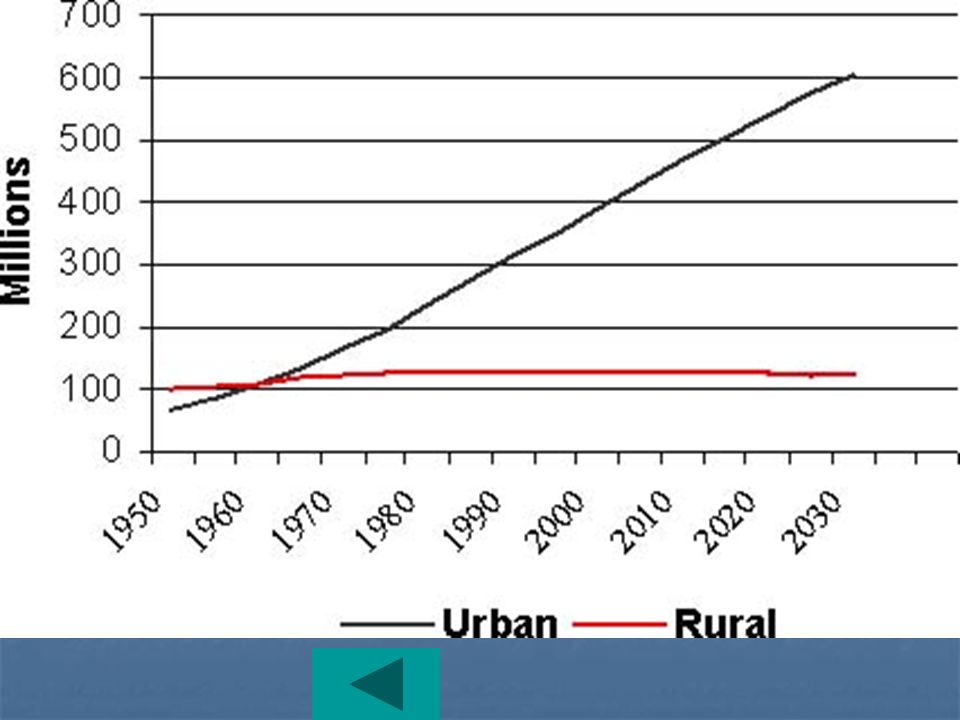
© T. M. Whitmore Urbanization Proportion of a country’s pop living in cities World = 49% Global South = 42-43% Global North = 75% USA = 79% LA = 76% LA Extremes in LA Large city urbanization in LA (% in cities > 1 million)
.")
20
© T. M. Whitmore Urbanization II Mega-cities Emerging Megalopolis zones Central Mexico Central Mexico South Brazil triangle & Río de la Plata South Brazil triangle Concept of primacy Single city in a country that dominates in pop, culture, economic development, etc. Examples: Examples Santo Domingo Guatemala City Mexico City Lima

27
LA cities in World’s top 100 (19 of the top 100)
")
30
Lima 10 x larger >20 x larger >15 x larger

31
© T. M. Whitmore Roots of urban growth Demographic R—to—Urban migration Natural increase Economic Industrialization Rural stagnation Organizations Banks and governments

32
© T. M. Whitmore Benefits from urban growth Efficient provision of social services Cities are centers of information flow and knowledge Concentrated (and better educated?) labor pool Physical infrastructure often better Cities concentrate “human capital” Cities are a huge internal markets Easier linkages between industries Cities are often “better off”
 labor pool Physical infrastructure often better Cities concentrate human capital Cities are a huge internal markets Easier linkages between industries Cities are often better off .")
33
© T. M. Whitmore Urban growth I Housing First destination of poor migrants is the inner city slums Elite often still in posh neighborhoods in inner city Elite Often close juxtaposition of rich and poorjuxtaposition

34
© T. M. Whitmore Elite housing, Santo Domingo

35
Mexico City country club

36
Mexican stock exchange

37
© T. M. Whitmore Wealthy homes in Morelia, Mexico

38
© Pearson Education – Prentice Hall Elite house Cuidad Juarez

39
© W.H. Freeman & Co.

40
© T. M. Whitmore Urban growth II Planned developments Self-help (often squatter) “slum” housing Self-help (often squatter) “slum” housing Called: favelas (Brazil), colonias proletarias, cuidades perdidas, etc. Seen as places of permanence 25-40% of total pop in some cities Initially settlements lack infrastructure A main characteristic is improvementimprovement New purchased housing
 slum housing Self-help (often squatter) slum housing Called: favelas (Brazil), colonias proletarias, cuidades perdidas, etc. Seen as places of permanence 25-40% of total pop in some cities Initially settlements lack infrastructure A main characteristic is improvementimprovement New purchased housing.")
41
Planned new housing area in Mexico City

42
Nezahualcoyotl: Planned housing area in Mexico City

43
Nezahualcoyotl - 3 millon people

44
Squatter housing in Mexico City

45
Mexico City inner city

46
© Pearson Education – Prentice Hall Squatters outside Lima

47
© W.H. Freeman & Co.

48
© T. M. Whitmore Self-help housing, Santo Domingo, DR

49
© T. M. Whitmore Self-help housing, Santo Domingo

50
© T. M. Whitmore Self-help housing, Santo Domingo

51
© T. M. Whitmore Self-help housing, Santo Domingo

52
© T. M. Whitmore Self-help housing, Lima

53
© T. M. Whitmore Self-help housing, Saltillo, Mexico

54
Return migrant (remittance funded) housing in Ecuador © Brad Jokish
 housing in Ecuador © Brad Jokish")
55
© T. M. Whitmore

56
Formal sector housing, Saltillo, Mexico

57
© T. M. Whitmore Formal sector housing, Tegucigalpa

58
© T. M. Whitmore Formal sector housing, Tegucigalpa

59
300+ low income homes in Ixtapaluca, Mexico - complex has more than 10,000!

60
© T. M. Whitmore Urban growth III Subsidy and Sink effects Congestion Pollution Loss of urban open space Poor provision of basic servicesservices Export of problems Poverty generally Employment not always good

61
Mexico City on a rare clear day

62
More typical Mexico City day

63
© T. M. Whitmore Urban water, Santo Domingo

64
© T. M. Whitmore Urban water, Santo Domingo

65
© T. M. Whitmore Subsidence in Mexico City

66
© T. M. Whitmore Subsidence in Mexico City

Similar presentations