Download presentation
Presentation is loading. Please wait.

1
Characterizing CCN Spectra to Investigate the Warm Rain Process by Subhashree Mishra

2
Outline An introduction to the warm rain process An introduction to the warm rain process Theory of droplet nucleation Theory of droplet nucleation Warm Rain Hypotheses Warm Rain Hypotheses Role of CCN in initiation of warm rain Role of CCN in initiation of warm rain Measurement of CCN in the RICO project Measurement of CCN in the RICO project Data Data Results and Conclusions Results and Conclusions

3
Warm Rain Characterized by precipitation due to cumulus convection at temperatures > 0 ˚C Characterized by precipitation due to cumulus convection at temperatures > 0 ˚C Occurs in clouds with sufficient liquid water and updraft lifetime to sustain collision–coalescence growth Occurs in clouds with sufficient liquid water and updraft lifetime to sustain collision–coalescence growth Mostly produced in shallow convections over the tropics and the midlatitudes Mostly produced in shallow convections over the tropics and the midlatitudes Cumulus convection is limited by the inversion cap and hence extends no more than 4km Cumulus convection is limited by the inversion cap and hence extends no more than 4km

4
Why Warm Rain? Cumulus convection resulting in warm rain is one of the most prevalent cloud types in the planet Cumulus convection resulting in warm rain is one of the most prevalent cloud types in the planet These clouds are ubiquitous over the tropical oceans These clouds are ubiquitous over the tropical oceans They play a vital role in estimating the global climate change and energy balance They play a vital role in estimating the global climate change and energy balance The processes controlling their evolution and coverage are not yet well understood The processes controlling their evolution and coverage are not yet well understood

5
Comparative sizes, concentrations and terminal velocities of typical precipitation particles (from McDonald, 1958)
")
6
Nucleation of droplets Homogeneous nucleation Homogeneous nucleation -- highly improbable in natural clouds since it requires supersaturations≥400% Heterogeneous nucleation Heterogeneous nucleation -- On Insoluble particles (less likely because of large contact angles) -- On Soluble particles (most favorable for droplet nucleation)
 -- On Soluble particles (most favorable for droplet nucleation)")
7
Heterogeneous Nucleation on Soluble Particles Governed by Governed by -- Kelvin (curvature) effect -- Raoult (solution) effect Combining Kelvin and Raoult Effect gives the equation for obtaining Kohler curve as S = e' s (r)/ e s (∞) = 1+a/r- b/r 3 Curvature term Solution term
 effect -- Raoult (solution) effect Combining Kelvin and Raoult Effect gives the equation for obtaining Kohler curve as S = e s (r)/ e s (∞) = 1+a/r- b/r 3 Curvature term Solution term")
8
Kohler curve for Ammonium Sulfate (Rogers, R. R., and M.K. Yau, 1989, A Short Course in Cloud Physics) a ≈ 3.3 * 10 -5 / T (cm) b ≈ 4.3 * i * M/m s (cm 3 ) i = coefficient of ionic activity of the salt
 a ≈ 3.3 * / T (cm) b ≈ 4.3 * i * M/m s (cm 3 ) i = coefficient of ionic activity of the salt.")
9
Warm Rain Hypotheses The Giant Nuclei Hypothesis The Giant Nuclei Hypothesis Turbulence Induced Mechanisms Turbulence Induced Mechanisms - Entrainment -mixing (homogeneous and inhomogeneous) -Stochastic condensation -Entity mixing
 -Stochastic condensation -Entity mixing")
10
Measurement of CCN in RICO CCN or Cloud Condensation Nuclei are essentially a subset of CN (condensation nuclei) CCN or Cloud Condensation Nuclei are essentially a subset of CN (condensation nuclei) activated at low supersaturations, typical in natural clouds and are mostly water soluble activated at low supersaturations, typical in natural clouds and are mostly water soluble CCN measurements in RICO were done using the two DRI CCN spectrometers mounted on the C 130 CCN measurements in RICO were done using the two DRI CCN spectrometers mounted on the C 130 Use of two instruments ensured Use of two instruments ensured -- redundancy in data -- expanded the supersaturation (S) range -- enabled in flight calibrations and -- optimized measurements by providing operation over different S ranges
 CCN or Cloud Condensation Nuclei are essentially a subset of CN (condensation nuclei) activated at low supersaturations, typical in natural clouds and are mostly water soluble activated at low supersaturations, typical in natural clouds and are mostly water soluble CCN measurements in RICO were done using the two DRI CCN spectrometers mounted on the C 130 CCN measurements in RICO were done using the two DRI CCN spectrometers mounted on the C 130 Use of two instruments ensured Use of two instruments ensured -- redundancy in data -- expanded the supersaturation (S) range -- enabled in flight calibrations and -- optimized measurements by providing operation over different S ranges")
11
Instrumentation for CCN Measurement On the C-130

12
Adjustment of the DRI CCN spectrometer inlet tip (from David C. Rogers, NCAR)
")
13
RICO Air Mass (generated by using the NOAA HYSPLIT model trajectories)
")
14
Mean RICO sounding Source: Rauber et al, 2006, In the Driver’s Seat – RICO and Education. (In preparation for Bull. Amer. Soc. Meteor. )
.")
15
Comparison of CCN Measurements made by the two DRI CCN Spectrometers

17
Total particle (CN) and cumulative CCN concentrations during a sounding
 and cumulative CCN concentrations during a sounding")
18
Vertical soundings of CCN at various S versus CN concentration during the AIRS2 project on November 24th, 2003

19
Figure 3: Sizes of CCN measured in RICO. Also plotted is the theoretical versus critical supersaturation (Sc) relationship
 relationship.")
22
Cloud adiabaticity versus droplet concentration r 2 = 0.88r 2 = 0.97

23
Table 2: Effective Supersaturations determined from adiabatic droplet concentrations (N a ) DateCNN a (min)S eff (min)N a (cm -3 )S eff (%)r2r2 December 16 (RF 06)385±193100~0.3195~ 0.80.677 December 17 (RF 07)163±9435~0.09102~.80.662 December 19 (RF08)202±3735~0.06106~ 1.00.501 January 5 RF(10)297±13480~0.1160~ 1.50.679 January 7 RF(11)272±269110~1.0282~ 2.20.516 January 11 RF(12)194±7380~0.8164~ 1.60.880
 DateCNN a (min)S eff (min)N a (cm -3 )S eff (%)r2r2 December 16 (RF 06)385±193100~0.3195~ December 17 (RF 07)163±9435~ ~ December 19 (RF08)202±3735~ ~ January 5 RF(10)297±13480~0.1160~ January 7 RF(11)272±269110~1.0282~ January 11 RF(12)194±7380~0.8164~")
24
Table 3: Effective supersaturations estimated by taking values corresponding to the mean, maximum and minimum droplet concentrations obtained for Lc/La in the range of 0.9 to 1.1.

25
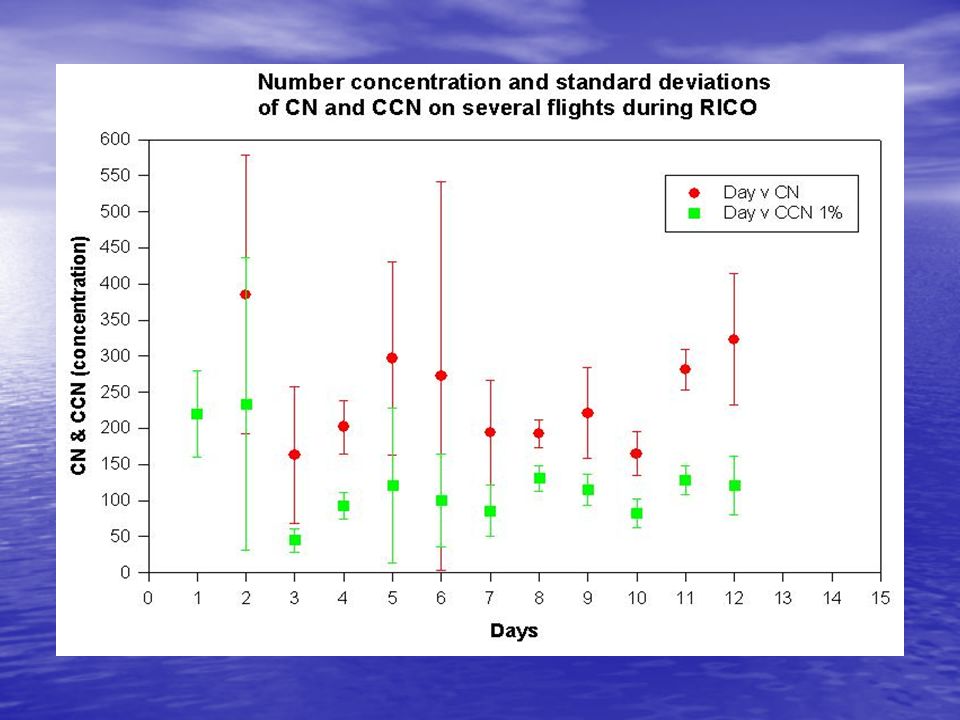
Results and Conclusions High standard deviations in particle concentrations implied significant day-to-day variability in concentrations Variability in particle concentrations at higher altitudes (~600mb) suggested long-range transport of continental aerosol Shift in vertical CCN distribution at approximately the cloud layer suggested cloud processing of aerosols Decrease in number of small CCN below clouds may be due to coagulation that results in increased concentration of large CCN Decrease in number of small CCN below clouds may be due to coagulation that results in increased concentration of large CCN High concentrations of large CCN at low altitudes may also be a result of sea spray High concentrations of large CCN at low altitudes may also be a result of sea spray
 suggested long-range transport of continental aerosol Shift in vertical CCN distribution at approximately the cloud layer suggested cloud processing of aerosols Decrease in number of small CCN below clouds may be due to coagulation that results in increased concentration of large CCN Decrease in number of small CCN below clouds may be due to coagulation that results in increased concentration of large CCN High concentrations of large CCN at low altitudes may also be a result of sea spray High concentrations of large CCN at low altitudes may also be a result of sea spray")
26
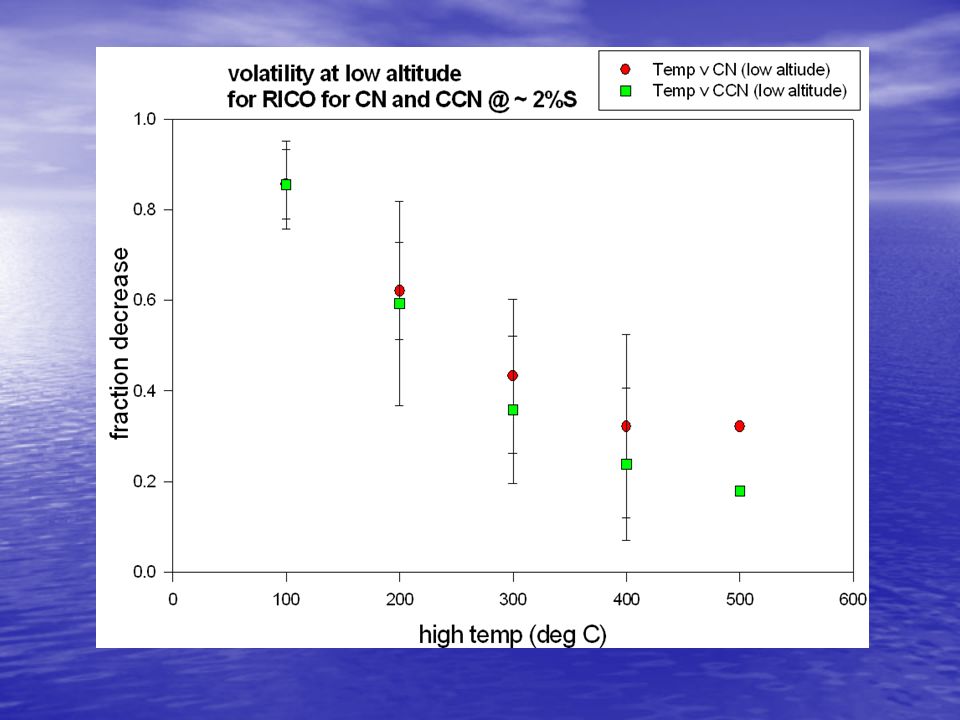
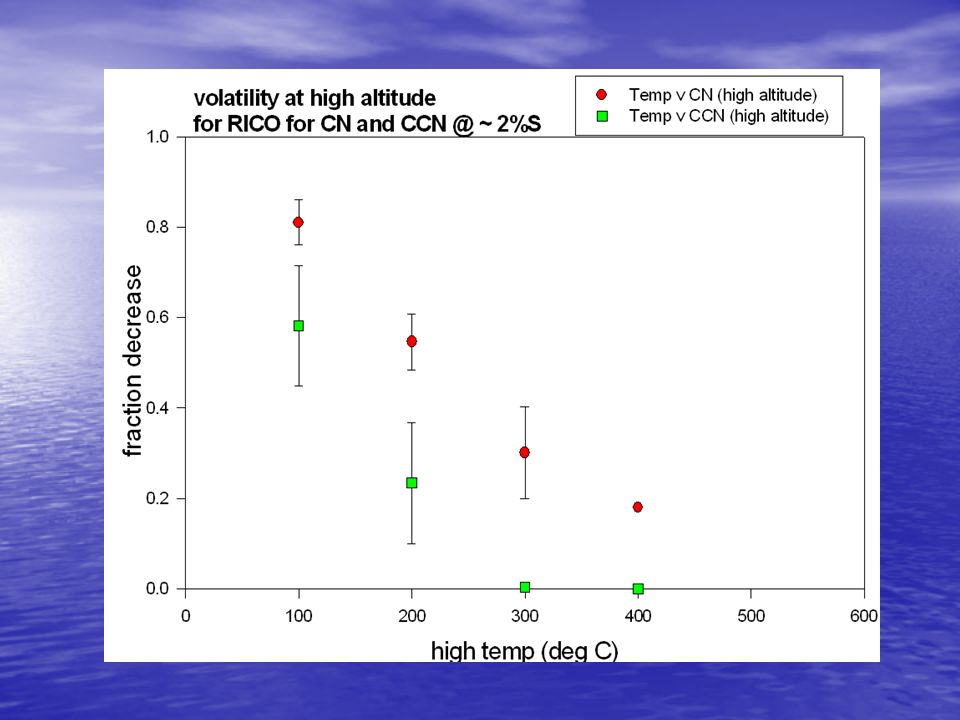
Volatility measurements suggested that most particles in RICO were highly soluble like NaCl or Ammonium Sulphate Volatility measurements suggested that most particles in RICO were highly soluble like NaCl or Ammonium Sulphate Size supersaturation measurements combined with volatility measurements suggested that most CCN in the boundary layer were more consistent with sulfate than NaCl Size supersaturation measurements combined with volatility measurements suggested that most CCN in the boundary layer were more consistent with sulfate than NaCl Effective supersaturations in these clouds were as high as 1.6 % Effective supersaturations in these clouds were as high as 1.6 % Inhomogeneous mixing seemed to be more common in these clouds although the presence of homogeneous mixing cannot be ruled out Inhomogeneous mixing seemed to be more common in these clouds although the presence of homogeneous mixing cannot be ruled out All the above factors combined together support the formation of large droplets that can enhance gravitational collection process and hence explain warm rain initiation All the above factors combined together support the formation of large droplets that can enhance gravitational collection process and hence explain warm rain initiation

27
Thank you !! Questions ?

Similar presentations


. Condensation and evaporation in the air (dew point). Stability of the atmosphere:>")


 at ~6 km 22 Nov. 0800 EST.>")


