Download presentation
Presentation is loading. Please wait.

1
WRAP/FEJF Phase III/IV Emissions Inventory Project WRAP - Fire Emissions Joint Forum Meeting San Diego, CA 22 February 2007 1015a – Presentation (a)
")
2
Overview Getting from Draft to Final Report Final Posting Page Kickoff of small project –Develop recommendation/discussion for emission inventory suites to model.

3
Getting from Draft to Final Posted for comment on Jan 25, 07 Comment period closed Feb 14, 07 2 comments received –CA Air Resources Board –US DOI Bureau of Land Management Summary of comments/responses Summary of “action items”

4
Final Posting Page http://www.wrapair.org/forums/fejf/tasks/ FEJFtask7Phase3-4.htmlhttp://www.wrapair.org/forums/fejf/tasks/ FEJFtask7Phase3-4.html Final Doc (PDF) will replace Draft Doc Walk-through of Ph III/IV EI files as they are posted on the WRAP’s web page. Questions/Comments

5
Kickoff of Small Project Limited resources for WRAP/RMC modeling Many possible combinations of emission inventory files –Different fire scenarios –Could be paired with different mixes of emission inventory files of other (non-fire sources)
")
6
Kickoff of Small Project Selection of fire EI files to run should hinge on getting answers to most important questions needed by FEJF/WRAP/States/Tribes as Regional Haze SIPs are prepared. Task team with technical direction provided by Air Sciences to formulate recommendations for FEJF/WRAP consideration. Timing

7
WRAP/FEJF Emission Inventory Projection Tool WRAP - Fire Emissions Joint Forum Meeting San Diego, CA 22 February 2007 1015a – Presentation (b)
")
8
Overview Integrate as tool available on the WRAP’s Technical Support System (TSS) Ideas to make more “lean and mean”
 Ideas to make more lean and mean")
9
Integrate as Tool on the TSS Goal is to have Fire-related Tools available on the TSS (in the same way that other tools are provided to generate SIP ready data summaries/analyses). Included as a task in the Scope of Work for the Fire Emissions Tracking System (FETS) development.
 development..")
10
Need to Make the Projection Tool “Lean and Mean” Summary of how Projection Tool is organized and functions now. –EXCEL-based. –Includes all (WRAP-wide) Phase III (Baseline) as “Seed Data” –User-provided data serve as activity Targets –Macros pluck Seed Data until Targets are reached Identify options to make the Projection Tool smaller and easier to use.
 Phase III (Baseline) as Seed Data –User-provided data serve as activity Targets –Macros pluck Seed Data until Targets are reached Identify options to make the Projection Tool smaller and easier to use..")
11
Need to Make the Projection Tool “Lean and Mean” Options to make the Projection Tool smaller and easier to grab and use. –Create 13 state-specific tools. –Limit Seed Data to representative (but relatively small) number of events. Lots of events in the Projection EI would be identical. Would have to apply statistics to temporally and spatially distribute. –Other?
 number of events. Lots of events in the Projection EI would be identical. Would have to apply statistics to temporally and spatially distribute. –Other .")
12
WRAP/FEJF Inter RPO Report WRAP - Fire Emissions Joint Forum Meeting San Diego, CA 22 February 2007 1015a – Presentation (c)
")
13
Overview Lessons Learned FCCS vs. NFDRS – a case study of wildfires in the WRAP region

14
Status of Draft Report 150pp report (approximate). Proofreading/Formatting in Golden as we speak. Perhaps some changes/additions to “Lessons Learned” section based on discussions today. Posted and available for review on Friday, February 23, 2007. 2-4 weeks for review/comment, make necessary revisions, then post as Final.

15
– Lessons Learned – Technical Methodology Big hitters: –“Blackened Acres” presumption 2/3 reported acres actually burned –FEPS-generated Fuel Consumption Consumption estimated as a function of moisture regime of fuel By definition, fuel consumption is less than available fuel loading –FEPS-generated Emission Factors

16
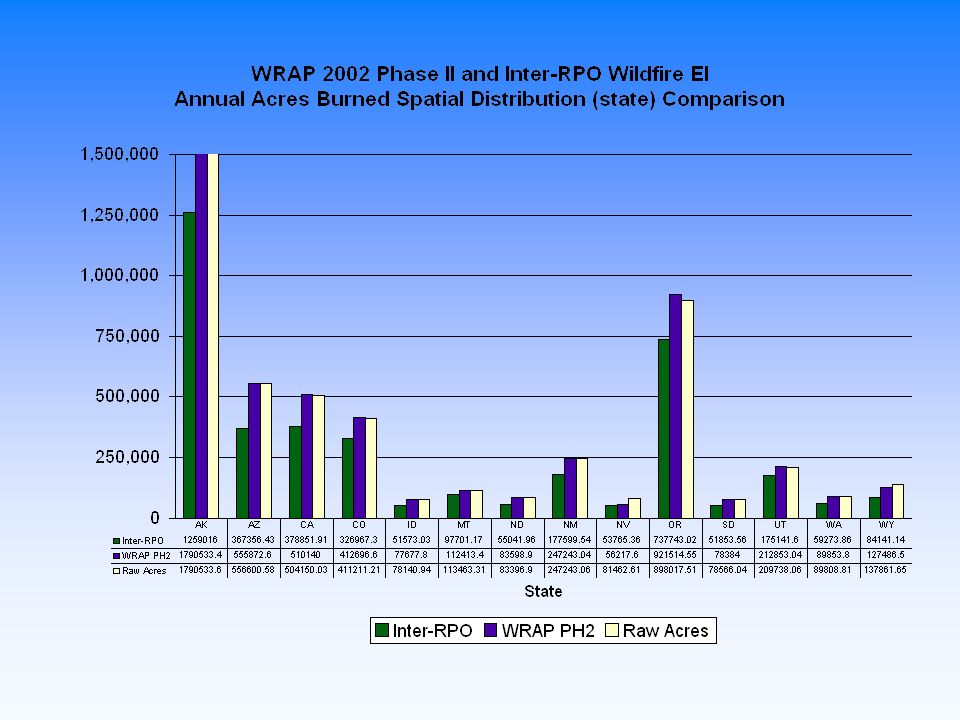
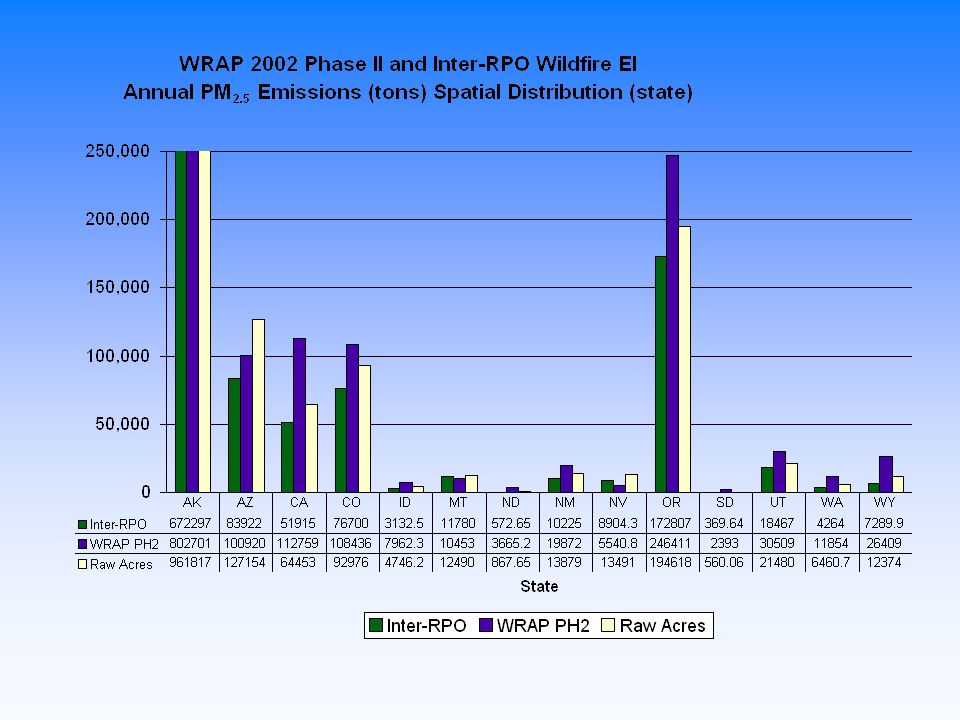
Inter RPO Results / WRAP Phase II Results

21
What should we do NEXT time? The labor is in the data gathering and QA/QC. –Is there any (better) way to gather, store, and disseminate activity data? Build and use a SCC coding system in coordination with EPA. Improve upon the “Blackened Acres Presumption” Use FEPS –The Consumption Curves make sense. –The burning phase- specific EFs make sense. –The smoldering method makes sense.
 way to gather, store, and disseminate activity data. Build and use a SCC coding system in coordination with EPA. Improve upon the Blackened Acres Presumption Use FEPS –The Consumption Curves make sense. –The burning phase- specific EFs make sense. –The smoldering method makes sense..")
22
How should we use the Inter RPO 2002 WF EI? If you want a wildfire EI that is developed in a consistent way across the US, there is probably no better. It might be an equitable way to set up “boundary” conditions due to WF emissions in regional modeling analyses. As a reference point to build “better” EI’s in the future: –Good activity data is everything. –Better fire science = more confidence in results. –Standards for NIF formats and SCC. –…and we’ve still got the challenge of representing these events “correctly” in the models (plume characteristics)
.")
23
Case Study: NFDRS vs. FCCS in the WRAP (2002) Different data sources are available to represent fuel loading (& consumption) across the US. –National Fire Danger Rating System –Fuel Characteristic Classification System This analysis attempts to quantify the effect on fuel loading estimates based on NFDRS vs. FCCS for the WRAP’s 2002 Fire Inventory
 Different data sources are available to represent fuel loading (& consumption) across the US. –National Fire Danger Rating System –Fuel Characteristic Classification System This analysis attempts to quantify the effect on fuel loading estimates based on NFDRS vs. FCCS for the WRAP’s 2002 Fire Inventory.")
24
Fuel Consumption Assignment Rules Rule #Fuel loading data availabilityAction 1 Event was subject to “ large fire ” fuel refinement in Phase II effort and received fuel loading based on site-level information Use refined Phase II tons 2 Fuel loading in tons or tons/acre supplied in raw activity data Use Phase II raw tons directly 3NFDRS code supplied in raw activity data Look up tons from Phase II NFDRS fuel loading table 4 Event subject to “ perimeter-based ” fuel refinement in Phase II Assign fuel loading using perimeter over FCC map 5 No fuel loading supplied in raw or refined activity data Assign fuel loading using FCC map

25
Basis for Fuel Consumption Values – Post Application of Fuel Assignment Rules (Percent of Acres) Source Type (Total Acres in EI) FCC- based Tons Fuel Consumption Reported in Raw Data Tons Fuel Consumption Derived via QC-effort NFDRS Fuel Model Reported in Raw Data Total Wildfire (5.3M) 13% 44%18%25%100% WFU (200K) 19% 79%0%2%100% Prescribed Burning (650K) 42% 53%0%5%100% Basis for Fuel Consumption Values (as a % of Total Acres) – Post Application of Fuel Assignment Rules
 Source Type (Total Acres in EI) FCC- based Tons Fuel Consumption Reported in Raw Data Tons Fuel Consumption Derived via QC-effort NFDRS Fuel Model Reported in Raw Data Total Wildfire (5.3M) 13% 44%18%25%100% WFU (200K) 19% 79%0%2%100% Prescribed Burning (650K) 42% 53%0%5%100% Basis for Fuel Consumption Values (as a % of Total Acres) – Post Application of Fuel Assignment Rules")
26
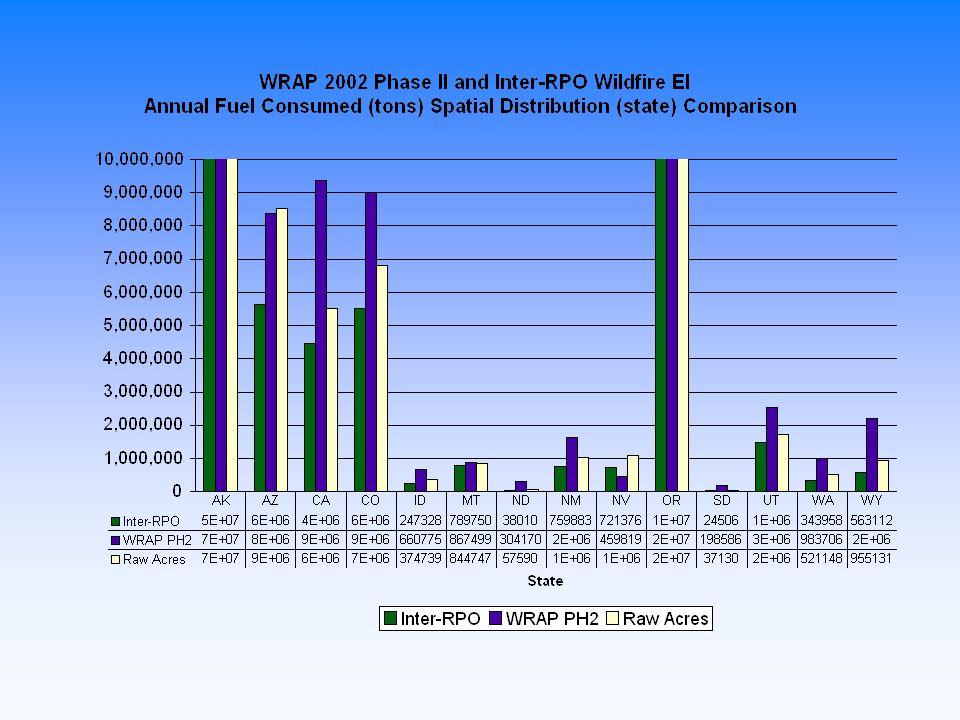
Fuel Consumption Comparison By State

27
Some More Statistics WRAP Wide –Fuel Consumption increases by 68% (from 48MM tons to 81MM tons) with the application of FCCS –Fuel Consumption increased in 8 states Oregon: –NFDRS G (short needle, heavy dead @ 43.5 tons/acre) …45% of the acres of the Biscuit Fire… converts to FCC2 (Western Hemlock (& others) @ 73.44 tons/acre)
 with the application of FCCS –Fuel Consumption increased in 8 states Oregon: –NFDRS G (short needle, heavy 43.5 tons/acre) …45% of the acres of the Biscuit Fire… converts to FCC2 (Western Hemlock (& tons/acre)")
Similar presentations


>")


