Download presentation
Presentation is loading. Please wait.

1
MATH 31 LESSONS Chapter 4: Max / Min Chapter 5: Sketching 3. Sketching Polynomials

2
Steps for Sketching Polynomial Functions Step 1. Degree State the degree of f (x) and identify the shape.
 and identify the shape..")
3
When the degree is even, then: if a > 1, it opens up Deg = 2 Deg = 4

4
When the degree is even, then: if a > 1, it opens up if a < 1, it opens down Deg = 2 Deg = 4 Deg = 2 Deg = 4

5
When the degree is odd, then: if a > 1, it rises to the right Deg = 3 Deg = 5

6
When the degree is odd, then: if a > 1, it rises to the right if a < 1, it falls to the right Deg = 3 Deg = 5

7
Step 2. Intercepts y-intercept(s) Let x = 0, and then solve for y x-intercept(s) Let y = 0, and then solve for x
 Let x = 0, and then solve for y x-intercept(s) Let y = 0, and then solve for x.")
8
Note: To find the x-intercept: Factor completely and find the zeros - for complex functions, you may need to use the factor theorem and long division

9
To find the x-intercept: For second degree factors of the form Ax 2 + Bx + C = 0, you can use the quadratic formula to solve. i.e.

10
To find the x-intercept: If you can’t factor or use the quadratic formula, then use Newton’s method for finding roots. i.e. Take a first guess x 1. Then, to find x 2 :

11
Step 3. First Derivative Test Differentiate and state the critical values i.e. When f (x) = 0
 = 0")
12
Differentiate and state the critical values i.e. When f (x) = 0 Use the interval test to show where the function is increasing and decreasing
 = 0 Use the interval test to show where the function is increasing and decreasing.")
13
Differentiate and state the critical values i.e. When f (x) = 0 Use the interval test to show where the function is increasing and decreasing Identify local (and absolute) max / mins - substitute into the original function to get the y-values
 = 0 Use the interval test to show where the function is increasing and decreasing Identify local (and absolute) max / mins - substitute into the original function to get the y-values.")
14
Step 4. Sketch the Function Place all intercepts and critical values on the grid Using your knowledge of where the function is increasing and decreasing, connect the dots Extend the arms on either side to infinity - recall that polynomial functions are continuous and have a domain x

15
Ex. 1Sketch the following function: Try this example on your own first. Then, check out the solution.

16
Degree: This function is of degree 3 and a > 0. Thus, this function will rise to the right.

17
Intercepts: y-intercept: (x = 0) So, there is a y-intercept at (0, 0).
 So, there is a y-intercept at (0, 0).")
18
x-intercepts: (y = 0) So, there are x-intercepts at (0, 0) and ( 6.93, 0)
 So, there are x-intercepts at (0, 0) and ( 6.93, 0)")
19
First Derivative Test:

20
Find CV’s

21
Interval test: 4 f -4 Sketch a number line, using the CV’s as boundaries

22
x < -4: Since f > 0, it is increasing. e.g. x = -5 4 f -4 ( ) ( )
 ( )")
23
-4 < x < 4: Since f < 0, it is increasing. e.g. x = 0 4 f -4 ( ) ( ) (+) ( )
 ( ) (+) ( )")
24
x > 4: Since f > 0, it is increasing. e.g. x = 5 4 f -4 ( ) ( ) (+) ( ) (+) (+)
 ( ) (+) ( ) (+) (+)")
25
Find the y-values by subbing them into the original function: Local Min Local Max 4 f -4 ( ) ( ) (+) ( ) (+) (+)
 ( ) (+) ( ) (+) (+)")
26
Sketch: -6.936.93 128 -128 y x First, put the intercepts and the CV’s on the graph -44

27
y Then, use the interval test to connect the dots. 4 f -4 -6.936.93 128 -128 x -44

28
Ex. 2Sketch the following function: Try this example on your own first. Then, check out the solution.

29
Degree: This function is of degree 4 and a > 0. Thus, this function will open up.

30
Intercepts: y-intercept: (x = 0) So, there is a y-intercept at (0, 4).
 So, there is a y-intercept at (0, 4).")
31
x-intercepts: (y = 0) So, there are x-intercepts at ( 1, 0) and ( 2, 0)
 So, there are x-intercepts at ( 1, 0) and ( 2, 0)")
32
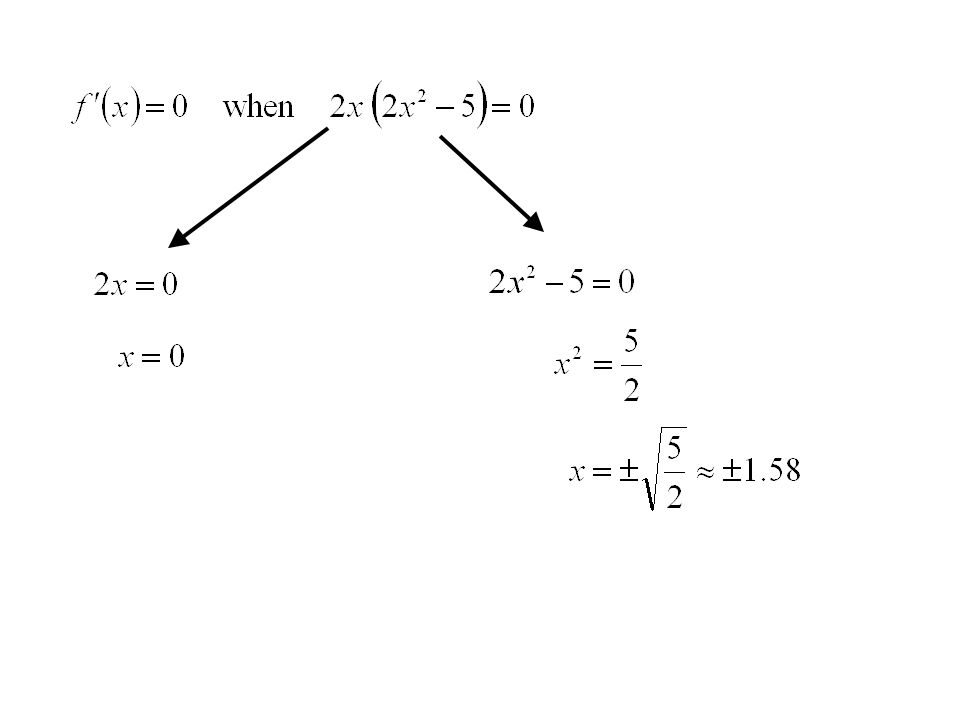
First Derivative Test:

34
Interval test: Sketch a number line, using the CV’s as boundaries 0 f -1.581.58

35
x < -1.58: Since f < 0, it is decreasing. e.g. x = -3 0 f -1.58 ( ) (+) 1.58
 (+) 1.58")
36
-1.58 < x < 0: Since f > 0, it is increasing. e.g. x = -1 0 f -1.58 ( ) (+) ( ) ( ) 1.58
 (+) ( ) ( ) 1.58")
37
0 < x < 1.58: Since f < 0, it is decreasing. e.g. x = 1 0 f -1.58 ( ) (+) ( ) ( ) (+) ( ) 1.58
 (+) ( ) ( ) (+) ( )")
38
x > 1.58: Since f > 0, it is increasing. e.g. x = 3 0 f -1.58 ( ) (+) ( ) ( ) (+) (+) (+) ( ) 1.58
 (+) ( ) ( ) (+) (+) (+) ( )")
39
Find the y-values by subbing them into the original function: Local Min Local Max 0 f -1.58 ( ) (+) ( ) ( ) (+) (+) (+) ( ) 1.58 Local Min
 (+) ( ) ( ) (+) (+) (+) ( ) 1.58 Local Min")
40
Sketch: -3 4 -4 y x First, put the intercepts and the CV’s on the graph -2132 (-1.58, -2.25)(1.58, 2.25)
(1.58, 2.25)")
41
Then, use the interval test to connect the dots. 0 f -1.581.58 -3 4 -4 y x -2132 (-1.58, -2.25)(1.58, 2.25)
(1.58, 2.25).")
Similar presentations


. x2 • x5 (-5) • (-5)8 x2 • x4 • x6 x • x4 • x3.>")


 = ax^2 + bx + c. In this form when: a>0 graph opens up a 0 Graph has 2 x-intercepts.>")


 = x 3 -3x 2 -45x+47. Solution I. Intercepts The x-intercepts are the solutions to 0= f(x) = x 3 -3x 2.>")


 m x n = 0 m or n.>")
 Factored form The FTA (Fundamental Theorem of Algebra) states that.>")

 = (x-4) 2 -1 2. f(x) = -2(x-3)(x+4) 3. f(x) = x 2 -2x -15 Answers:>")
