Download presentation
Presentation is loading. Please wait.

1
Wine Market Council Presentation December 9, 2004

2
Wine Market Council Internet Consumer Survey Conducted in June/July 2004 by Merrill Research 1328 respondents (558 core, 770 marginal) Screener criteria same as previous surveys Data weighted by gender and income
 Screener criteria same as previous surveys Data weighted by gender and income")
3
Key Consumer Attitudes and Behaviors – 2004 Core Marginal Likes Taste 93% 85% Wine makes occasion formal 46% 54% Drinks wine only on special occasions 8% 41% (Percentages by segment) Source: Merrill Research & Associates
 Source: Merrill Research & Associates")
4
Positive Attitudes – 2004 Source: Merrill Research & Associates Makes a good gift9592 Can buy good wine without spending a lot 9688 Moderate use is good for you 9490 Core Marginal (Percentages by segment)
")
5
Consumption Barriers – 2004 Source: Merrill Research & Associates Like having a bottle on hand 9268 Open bottle stays fresh for 2 – 3 days 6855 Don’t like to open a whole bottle for myself 3461 Core Marginal (Percentages by segment)
")
6
(Percentages) Table Wine Drinking Frequency – 2004 Source: Merrill Research & Associates Daily Wkly+ Once Wk 2-3X Mo Monthly 2-3 Mo 5% 22% 15% 24% 17%
 Table Wine Drinking Frequency – 2004 Source: Merrill Research & Associates Daily Wkly+ Once Wk 2-3X Mo Monthly 2-3 Mo 5% 22% 15% 24% 17%")
7
Drinking More v. Less Wine (Net gain by segment – 2004) 39% 3% 36% 1% 41% 4% Source: Merrill Research & Associates
 39% 3% 36% 1% 41% 4% Source: Merrill Research & Associates.")
8
Prefer wine to other alcohol beverages? (Percentages by segment – 2004) Source: Merrill Research & Associates 74 32 48 67 80 42
 Source: Merrill Research & Associates")
9
Purchases by Price Category (750ml, Top 2 box by segment) Source: Merrill Research & Associates 11 39 82 63 32 28 6 78 75 55 33 72
 Source: Merrill Research & Associates")
10
Import & Domestic Wine Consumption - 2004 Core Marginal Source: Merrill Research & Associates Domestic 70% Import 30% Domestic 77% Import 23%

11
Source: Merrill Research & Associates Core v. Marginal Ratio by Generation – 2004 63 37 36 64 44 56 (Percentages by generation)
.")
12
Source: Merrill Research & Associates 15 23 46 42 38 30 Did your parents drink wine? (Percentages by generation) 2 19 36 41 4 4
")
13
Source: Merrill Research & Associates Currently on a low carbohydrate diet? (Percentages by segment) 20 18 26 16
")
14
Source: Merrill Research & Associates Purchased screwcap wine in past 3 months? (Percentages by generation) 25 20
")
15
Source: Merrill Research & Associates How often buy brand never seen or heard of? (Top two box by segment) 69% 53%
 69% 53%.")
16
Most Recent Purchases (Percentages by region, Core and Marginal) Source: Merrill Research & Associates 87 74 46 29 43 22 36 20 23 15 22 11 16 11
 Source: Merrill Research & Associates")
17
Recent Purchases – California (Percentages by region, Core and Marginal) Source: Merrill Research & Associates 71 54 52 36
 Source: Merrill Research & Associates")
18
Purchase Motivator Statements The wine I purchased is unique to the region where it was produced I prefer the flavor of the wine I purchased compared to similar wines from other regions The wine I purchased is better quality than similar wines from other regions The wine I purchased is a better value than similar wines from other regions

19
Source: Merrill Research & Associates 42 59 56 53 49 Purchase Factors/Beliefs (Percentages by world region) 59 41 61 47 38 33 54 51 55
")
20
Source: Merrill Research & Associates 42 56 52 53 43 Purchase Factors/Beliefs (Percentages by U.S. region) 59 54 47 45 46 47 51 55 46 50
")
21
Source: Merrill Research & Associates 47 63 56 Purchase Factors/Beliefs – California Wines 62 38 51 50 57 (Percentages, Core and Marginal)
")
22
Source: Merrill Research & Associates 47 56 54 Ratings as “Unique” – California Wine Purchasers 38 48 38 (Percentages, Core and Marginal)
")
23
Source: Merrill Research & Associates 69 49 41 Purchase Factors/Beliefs – French Wines 31 50 45 35 (Percentages, Core and Marginal)
")
24
Source: Merrill Research & Associates 66 52 49 Purchase Factors/Beliefs – Italian Wines 45 51 54 49 37 (Percentages, Core and Marginal)
")
25
Source: Merrill Research & Associates 54 52 49 Purchase Factors/Beliefs – Australian Wines 56 54 55 54 53 (Percentages, Core and Marginal)
")
26
Source: Merrill Research & Associates 56 51 44 Purchase Factors/Beliefs – New York Wines 48 45 60 47 51 (Percentages, Core and Marginal)
")
27
Source: Merrill Research & Associates 65 55 44 Purchase Factors/Beliefs – Oregon Wines 56 47 50 41 52 (Percentages, Core and Marginal)
")
28
Source: Merrill Research & Associates 42 43 41 Purchase Factors/Beliefs – Washington Wines 46 54 48 52 48 (Percentages, Core and Marginal)
")
29
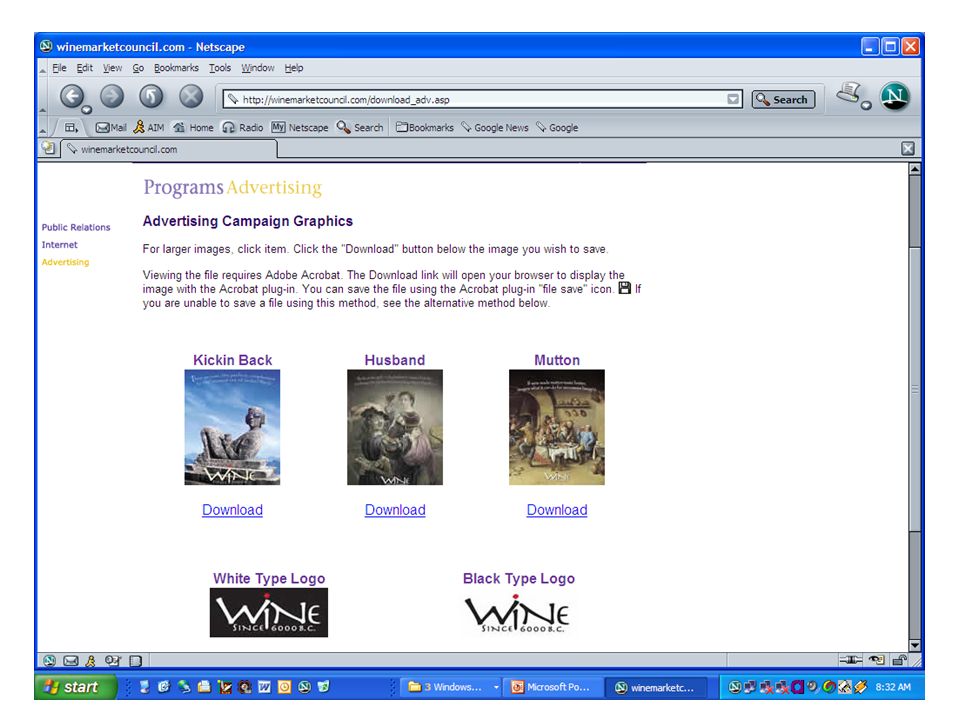
A Campaign for the Wine Industry

31
Wine. Since 6000 B.C. Focus on the authenticity of wine A statement only the wine industry can make Juxtaposes ancient and modern images to capture the imagination Humorous copy lines deliver the message: “wine is a casual, everyday enjoyment”

32
“Kickin’ Back”

33
“Husband”

34
“Mutton”

35
Columbus Test Market

36
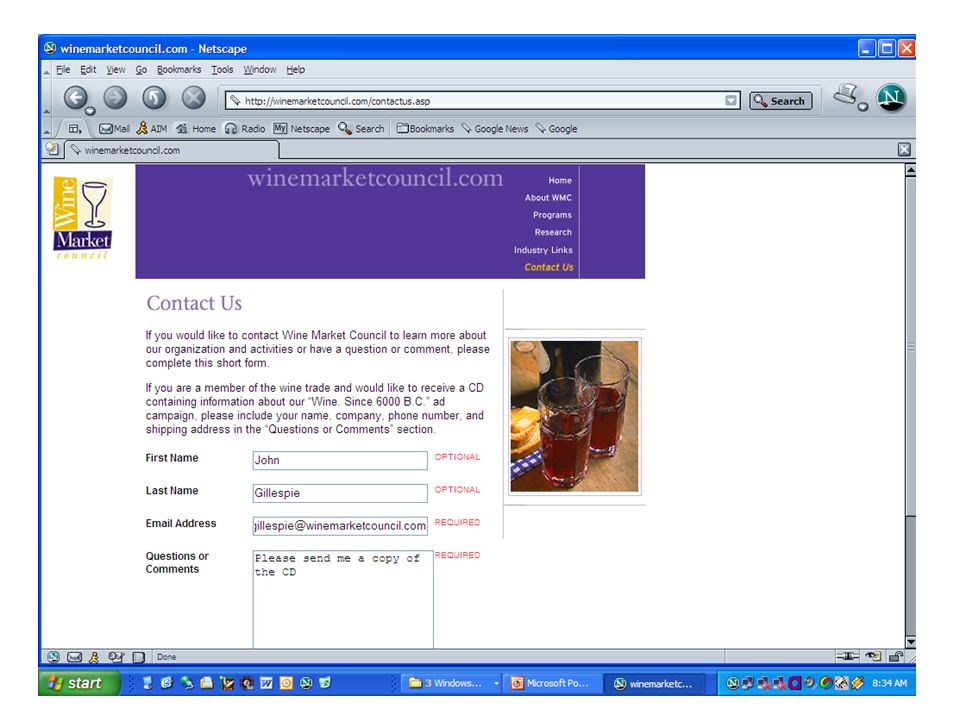
Columbus Test Market Campaign October 20 to November 28 Print placements in Columbus Dispatch, USA Weekend, Columbus Monthly PR and merchandising initiatives Pre and post consumer survey, focus groups, IRI scan data matched market analysis

40
Wine Market Council Presentation December 9, 2004

Similar presentations
 Why Is Segmentation Important? –CConsider a heterogeneous hypothetical market Scatter plot of ideal products of customers in the market.>")


