Download presentation
Presentation is loading. Please wait.

1
Determination of National Income and the Role of Fiscal Policy

2
Equilibrium Level of National Income The circular flow of income

3
A simplified circular flow of income model

4
CdCd

5
CdCd Incomes A simplified circular flow of income model

6
CdCd W = S + T + M Incomes A simplified circular flow of income model

7
CdCd W = S + T + M J = I + G + X Incomes A simplified circular flow of income model

8
Effect on national income of a change in injections and/or withdrawals –J > W: national income rises –W > J: national income falls The Keynesian diagram: the withdrawals and injections approach –the withdrawals curve Effect on national income of a change in injections and/or withdrawals –J > W: national income rises –W > J: national income falls The Keynesian diagram: the withdrawals and injections approach –the withdrawals curve Equilibrium Level of National Income

9
O Y W C d, W, J Deriving equilibrium national income

10
Effect on national income of a change in injections and/or withdrawals –J > W: national income rises –W > J: national income falls The Keynesian diagram: the withdrawals and injections approach –the withdrawals curve –the injections curve Effect on national income of a change in injections and/or withdrawals –J > W: national income rises –W > J: national income falls The Keynesian diagram: the withdrawals and injections approach –the withdrawals curve –the injections curve Equilibrium Level of National Income

11
O Y W C d, W, J J Deriving equilibrium national income

12
Effect on national income of a change in injections and/or withdrawals –J > W: national income rises –W > J: national income falls The Keynesian diagram: the withdrawals and injections approach –the withdrawals curve –the injections curve –equilibrium Effect on national income of a change in injections and/or withdrawals –J > W: national income rises –W > J: national income falls The Keynesian diagram: the withdrawals and injections approach –the withdrawals curve –the injections curve –equilibrium Equilibrium Level of National Income

13
O Y W C d, W, J J Y1Y1 b a Deriving equilibrium national income

14
O Y W C d, W, J J Y2Y2 d c Deriving equilibrium national income

15
O Y W C d, W, J J YeYe x Deriving equilibrium national income

16
The Keynesian diagram: the income and expenditure approach –the 45° line The Keynesian diagram: the income and expenditure approach –the 45° line Equilibrium Level of National Income

17
O Y Y = C d + W W C d, W, J J Deriving equilibrium national income

18
The Keynesian diagram: the income and expenditure approach –the 45° line –the expenditure curve The Keynesian diagram: the income and expenditure approach –the 45° line –the expenditure curve Equilibrium Level of National Income

19
O Y W C d, W, J J CdCd Y = C d + W E = C d + J J Deriving equilibrium national income

20
The Keynesian diagram: the income and expenditure approach –the 45° line –the expenditure curve –equilibrium The Keynesian diagram: the income and expenditure approach –the 45° line –the expenditure curve –equilibrium Equilibrium Level of National Income

21
O Y W C d, W, J J CdCd Y = C d + W E = C d + J Y1Y1 f e Deriving equilibrium national income

22
O Y W C d, W, J J CdCd Y = C d + W E = C d + J Y2Y2 h g Deriving equilibrium national income

23
O Y W C d, W, J J CdCd Y = C d + W E = C d + J YeYe x z Deriving equilibrium national income

24
The Multiplier The multiplier: introduction –the circular flow of income and effects of changes in injections –definition of the multiplier: ΔY/ΔJ The withdrawals and injections approach –graphical analysis: shift in the J line The multiplier: introduction –the circular flow of income and effects of changes in injections –definition of the multiplier: ΔY/ΔJ The withdrawals and injections approach –graphical analysis: shift in the J line

25
The multiplier: (a) a shift in injections O Y W W, J J1J1 Ye1Ye1 a
 a shift in injections O Y W W, J J1J1 Ye1Ye1 a")
26
O Y W J1J1 J2J2 Ye1Ye1 a Ye2Ye2 b The multiplier: (a) a shift in injections
 a shift in injections")
27
O Y W J1J1 J2J2 Ye1Ye1 a Ye2Ye2 b YY c WW JJ J1J1 J2J2 Multiplier = Y / J = Y / W = c a / b c W, J The multiplier: (a) a shift in injections
 a shift in injections")
28
The Multiplier The multiplier: introduction –the circular flow of income and effects of changes in injections –definition of the multiplier: ΔY/ΔJ The withdrawals and injections approach –graphical analysis: shift in the J line –the formula: 1/mpw – or: 1/(1–mpc d ) The multiplier: introduction –the circular flow of income and effects of changes in injections –definition of the multiplier: ΔY/ΔJ The withdrawals and injections approach –graphical analysis: shift in the J line –the formula: 1/mpw – or: 1/(1–mpc d )
 The multiplier: introduction –the circular flow of income and effects of changes in injections –definition of the multiplier: ΔY/ΔJ The withdrawals and injections approach –graphical analysis: shift in the J line –the formula: 1/mpw – or: 1/(1–mpc d )")
29
O Y W J1J1 J2J2 Ye1Ye1 a Ye2Ye2 b YY c WW JJ J1J1 J2J2 Multiplier = Y / J = Y / W = c a / b c = 1/mpw W, J The multiplier: (a) a shift in injections
 a shift in injections")
30
The Multiplier The multiplier: introduction –the circular flow of income and effects of changes in injections –definition of the multiplier: ΔY/ΔJ The withdrawals and injections approach –graphical analysis: shift in the J line –the formula: 1/mpw – or: 1/(1–mpc d ) –graphical analysis: shift in the W line The multiplier: introduction –the circular flow of income and effects of changes in injections –definition of the multiplier: ΔY/ΔJ The withdrawals and injections approach –graphical analysis: shift in the J line –the formula: 1/mpw – or: 1/(1–mpc d ) –graphical analysis: shift in the W line
 –graphical analysis: shift in the W line The multiplier: introduction –the circular flow of income and effects of changes in injections –definition of the multiplier: ΔY/ΔJ The withdrawals and injections approach –graphical analysis: shift in the J line –the formula: 1/mpw – or: 1/(1–mpc d ) –graphical analysis: shift in the W line")
31
The multiplier: (b) a shift in withdrawals O Y W1W1 J Ye1Ye1 a W, J
 a shift in withdrawals O Y W1W1 J Ye1Ye1 a W, J")
32
O Y W1W1 J Ye1Ye1 a W2W2 Ye2Ye2 c The multiplier: (b) a shift in withdrawals
 a shift in withdrawals")
33
O Y W1W1 J Ye1Ye1 a W, J W2W2 Ye2Ye2 c YY WW b Multiplier = Y / W = c a / a b The multiplier: (b) a shift in withdrawals
 a shift in withdrawals")
34
The Multiplier The multiplier: introduction –the circular flow of income and effects of changes in injections –definition of the multiplier: ΔY/ΔJ The withdrawals and injections approach –graphical analysis: shift in the J line –the formula: 1/mpw – or: 1/(1–mpc d ) –graphical analysis: shift in the W line The income and expenditure approach The multiplier: introduction –the circular flow of income and effects of changes in injections –definition of the multiplier: ΔY/ΔJ The withdrawals and injections approach –graphical analysis: shift in the J line –the formula: 1/mpw – or: 1/(1–mpc d ) –graphical analysis: shift in the W line The income and expenditure approach
 –graphical analysis: shift in the W line The income and expenditure approach The multiplier: introduction –the circular flow of income and effects of changes in injections –definition of the multiplier: ΔY/ΔJ The withdrawals and injections approach –graphical analysis: shift in the J line –the formula: 1/mpw – or: 1/(1–mpc d ) –graphical analysis: shift in the W line The income and expenditure approach")
35
The Multiplier The multiplier: introduction –the circular flow of income and effects of changes in injections –definition of the multiplier: ΔY/ΔJ The withdrawals and injections approach –graphical analysis: shift in the J line –the formula: 1/mpw – or: 1/(1–mpc d ) –graphical analysis: shift in the W line The income and expenditure approach –graphical analysis: shift in the E line The multiplier: introduction –the circular flow of income and effects of changes in injections –definition of the multiplier: ΔY/ΔJ The withdrawals and injections approach –graphical analysis: shift in the J line –the formula: 1/mpw – or: 1/(1–mpc d ) –graphical analysis: shift in the W line The income and expenditure approach –graphical analysis: shift in the E line
 –graphical analysis: shift in the W line The income and expenditure approach –graphical analysis: shift in the E line The multiplier: introduction –the circular flow of income and effects of changes in injections –definition of the multiplier: ΔY/ΔJ The withdrawals and injections approach –graphical analysis: shift in the J line –the formula: 1/mpw – or: 1/(1–mpc d ) –graphical analysis: shift in the W line The income and expenditure approach –graphical analysis: shift in the E line")
36
The multiplier: (c) a shift in the expenditure curve O Y E, W, J Y E1E1 Ye1Ye1
 a shift in the expenditure curve O Y E, W, J Y E1E1 Ye1Ye1")
37
O Y Y E1E1 Ye1Ye1 E2E2 Ye2Ye2 The multiplier: (c) a shift in the expenditure curve
 a shift in the expenditure curve")
38
O Y Y E1E1 Ye1Ye1 E2E2 Ye2Ye2 Multiplier = Y / J = c a / b a a c YY JJ E, W, J b The multiplier: (c) a shift in the expenditure curve
 a shift in the expenditure curve")
39
'Full-employment' national income 'Gap' analysis –the deflationary gap 'Full-employment' national income 'Gap' analysis –the deflationary gap Keynesian Analysis of Unemployment and Inflation

40
O Y W W, J J YeYe The deflationary gap

41
O Y W W, J J YeYe YFYF Deflationary gap c d The deflationary gap

42
O Y W, J, E YeYe YFYF Y E The deflationary gap

43
O Y YeYe YFYF Y E a b Deflationary gap W, J, E The deflationary gap

44
O Y W J YeYe YFYF c d Y E a b Deflationary gap W, J, E The deflationary gap

45
'Full-employment' national income 'Gap' analysis –the deflationary gap –the inflationary gap 'Full-employment' national income 'Gap' analysis –the deflationary gap –the inflationary gap Keynesian Analysis of Unemployment and Inflation

46
O Y W W, J YeYe J The inflationary gap

47
O Y W W, J YeYe YFYF J The inflationary gap

48
O Y W W, J YeYe YFYF Inflationary gap J g h The inflationary gap

49
O Y Y E W, J, E YeYe The inflationary gap

50
O Y Y E W, J, E YeYe The inflationary gap

51
O Y YFYF Y E Inflationary gap W, J, E e f YeYe The inflationary gap

52
O Y YeYe YFYF Y E Inflationary gap e f W J g h W, J, E The inflationary gap

53
'Full-employment' national income 'Gap' analysis –the deflationary gap –the inflationary gap –policy implications 'Full-employment' national income 'Gap' analysis –the deflationary gap –the inflationary gap –policy implications Keynesian Analysis of Unemployment and Inflation

54
'Full-employment' national income 'Gap' analysis –the deflationary gap –the inflationary gap –policy implications Inflation and unemployment together 'Full-employment' national income 'Gap' analysis –the deflationary gap –the inflationary gap –policy implications Inflation and unemployment together Keynesian Analysis of Unemployment and Inflation

55
'Full-employment' national income 'Gap' analysis –the deflationary gap –the inflationary gap –policy implications Inflation and unemployment together –inflationary pressures before the full- employment level of income 'Full-employment' national income 'Gap' analysis –the deflationary gap –the inflationary gap –policy implications Inflation and unemployment together –inflationary pressures before the full- employment level of income Keynesian Analysis of Unemployment and Inflation

56
'Full-employment' national income 'Gap' analysis –the deflationary gap –the inflationary gap –policy implications Inflation and unemployment together –inflationary pressures before the full- employment level of income –implications for shape of AS curve 'Full-employment' national income 'Gap' analysis –the deflationary gap –the inflationary gap –policy implications Inflation and unemployment together –inflationary pressures before the full- employment level of income –implications for shape of AS curve Keynesian Analysis of Unemployment and Inflation

57
O Y Price level YFYF AS 1 Unemployment and inflation

58
O Y AS 1 Price level YFYF AS 2 Unemployment and inflation

59
'Full-employment' national income 'Gap' analysis –the deflationary gap –the inflationary gap –policy implications Inflation and unemployment together –inflationary pressures before the full- employment level of income –implications for shape of AS curve –effect of an increase in aggregate demand 'Full-employment' national income 'Gap' analysis –the deflationary gap –the inflationary gap –policy implications Inflation and unemployment together –inflationary pressures before the full- employment level of income –implications for shape of AS curve –effect of an increase in aggregate demand Keynesian Analysis of Unemployment and Inflation

60
O Price level National output YPYP The effects of increases in aggregate demand on national output AS

61
O Y1Y1 Price level National output Y2Y2 AS Y3Y3 Y4Y4 YPYP AD 3 AD 2 AD 1 AD 4 The effects of increases in aggregate demand on national output

62
The Phillips curve –the shape of the curve The Phillips curve –the shape of the curve Keynesian Analysis of Unemployment and Inflation

63
The original Phillips curve Unemployment (%) Wage inflation (%)
 Wage inflation (%)")
64
The Phillips curve –the shape of the curve –the position of the curve The Phillips curve –the shape of the curve –the position of the curve Keynesian Analysis of Unemployment and Inflation

65
The original Phillips curve Unemployment (%) Wage inflation (%)
 Wage inflation (%)")
66
The Phillips curve –the shape of the curve –the position of the curve –policy implications of the curve The Phillips curve –the shape of the curve –the position of the curve –policy implications of the curve Keynesian Analysis of Unemployment and Inflation

67
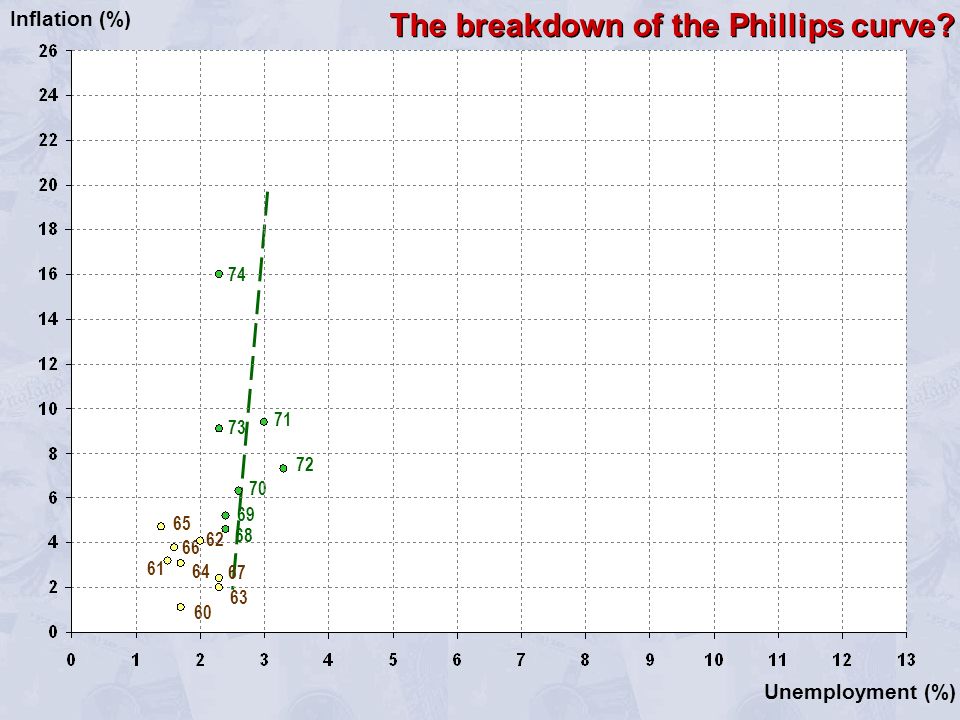
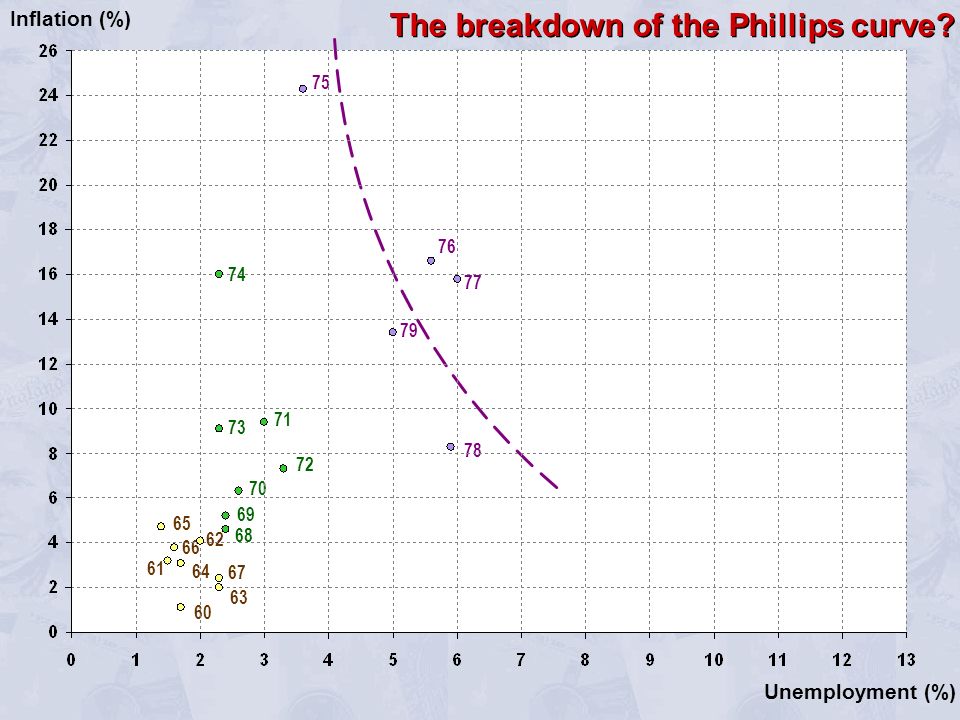
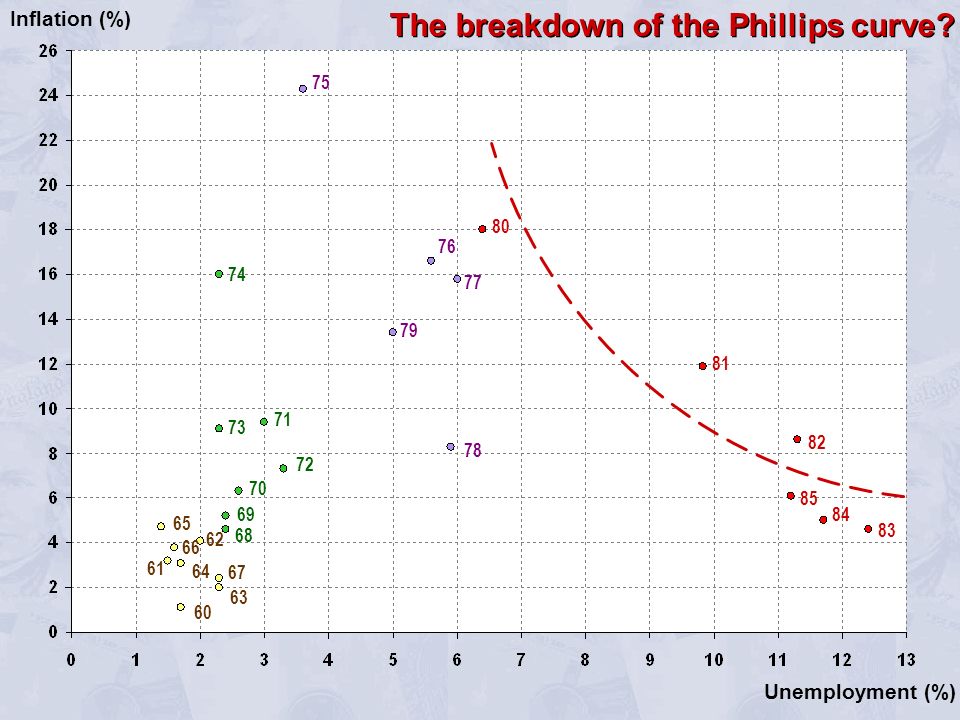
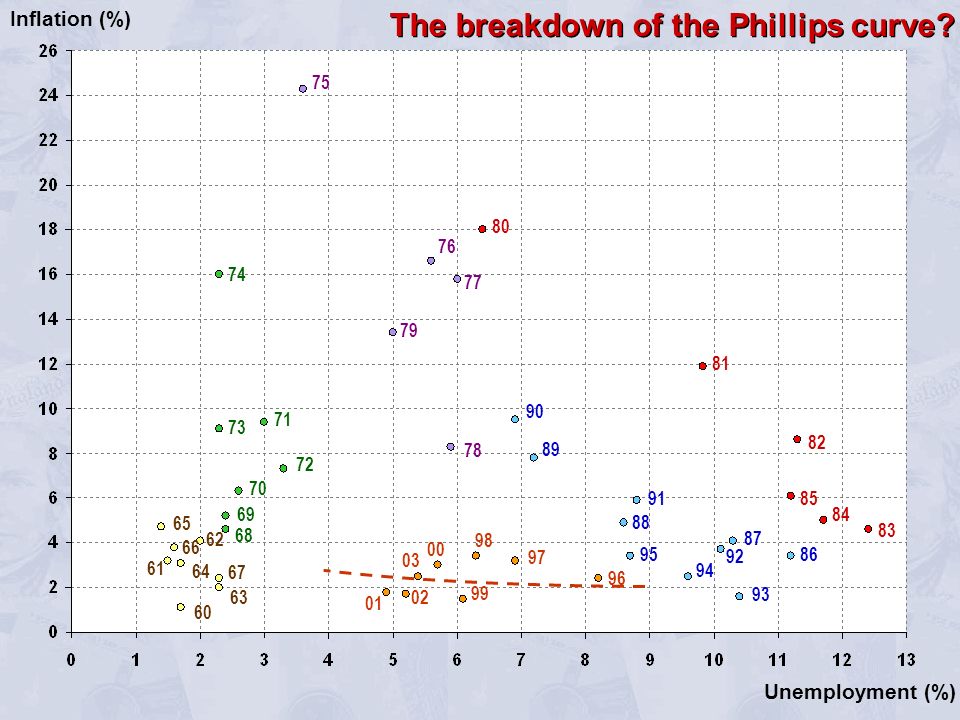
The Phillips curve –the shape of the curve –the position of the curve –policy implications of the curve –the breakdown of the curve The Phillips curve –the shape of the curve –the position of the curve –policy implications of the curve –the breakdown of the curve Keynesian Analysis of Unemployment and Inflation

68
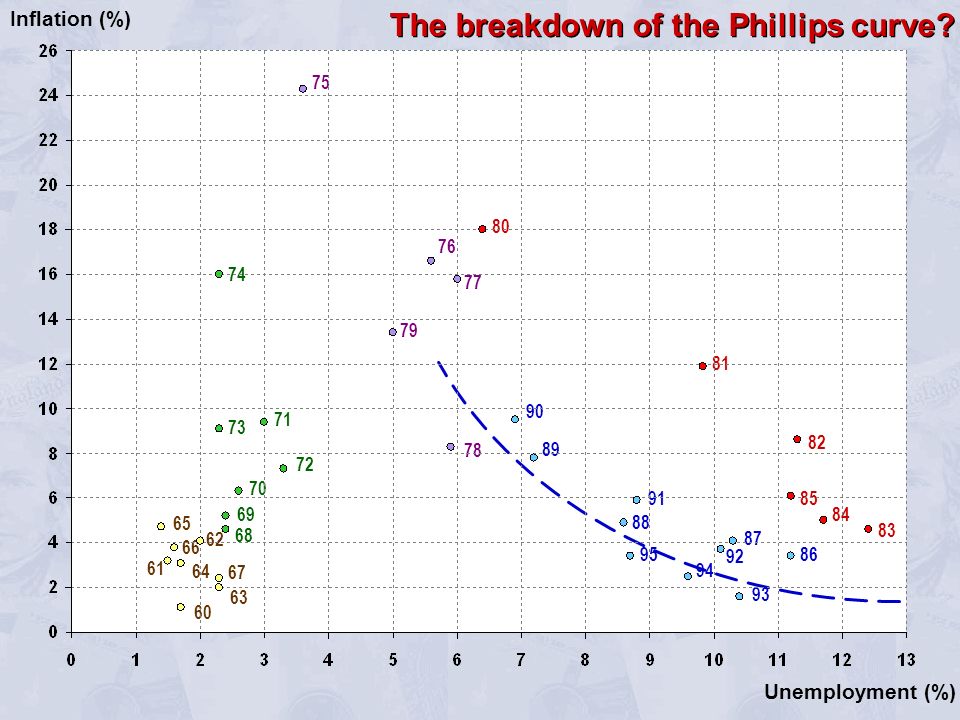
The Phillips curve –the shape of the curve –the position of the curve –policy implications of the curve –the breakdown of the curve –recent relationship between inflation and unemployment The Phillips curve –the shape of the curve –the position of the curve –policy implications of the curve –the breakdown of the curve –recent relationship between inflation and unemployment Keynesian Analysis of Unemployment and Inflation

69
Inflation (%) Unemployment (%) The breakdown of the Phillips curve? 67 63 62 65 66 64 60 61
 Unemployment (%) The breakdown of the Phillips curve")
70
Inflation (%) Unemployment (%) The breakdown of the Phillips curve? 67 63 62 65 66 64 60 61 Original Phillips curve

71
74 71 73 70 72 Inflation (%) Unemployment (%) The breakdown of the Phillips curve? 69 68 67 63 62 65 66 64 60 61
72
75 74 76 77 79 71 73 70 72 78 Inflation (%) Unemployment (%) The breakdown of the Phillips curve? 69 68 67 63 62 65 66 64 60 61
73
75 74 80 76 77 79 71 73 70 72 78 82 83 84 85 81 Inflation (%) Unemployment (%) The breakdown of the Phillips curve? 69 68 67 63 62 65 66 64 60 61
74
75 74 80 76 77 79 71 73 70 72 78 90 89 91 88 95 82 83 84 85 86 93 87 92 94 81 Inflation (%) Unemployment (%) The breakdown of the Phillips curve? 69 68 67 63 62 65 66 64 60 61
75
75 74 80 76 77 79 71 73 70 72 78 90 89 97 96 91 88 95 82 83 84 85 86 93 87 92 94 81 Inflation (%) Unemployment (%) The breakdown of the Phillips curve? 69 68 67 63 62 65 66 64 60 61 99 98 00 01 03 02
76
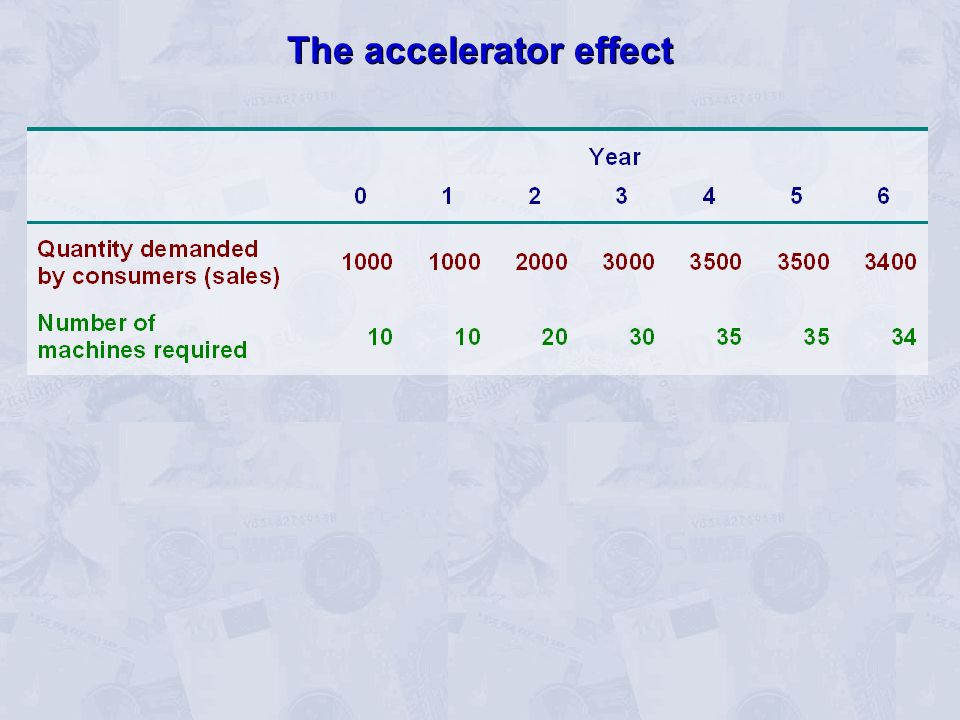
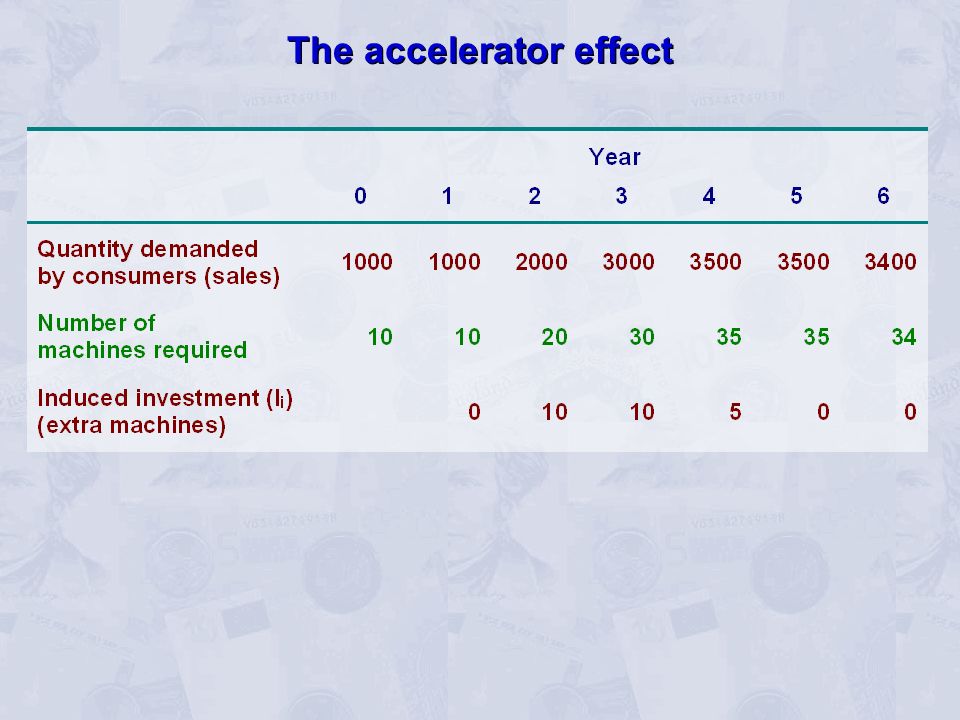
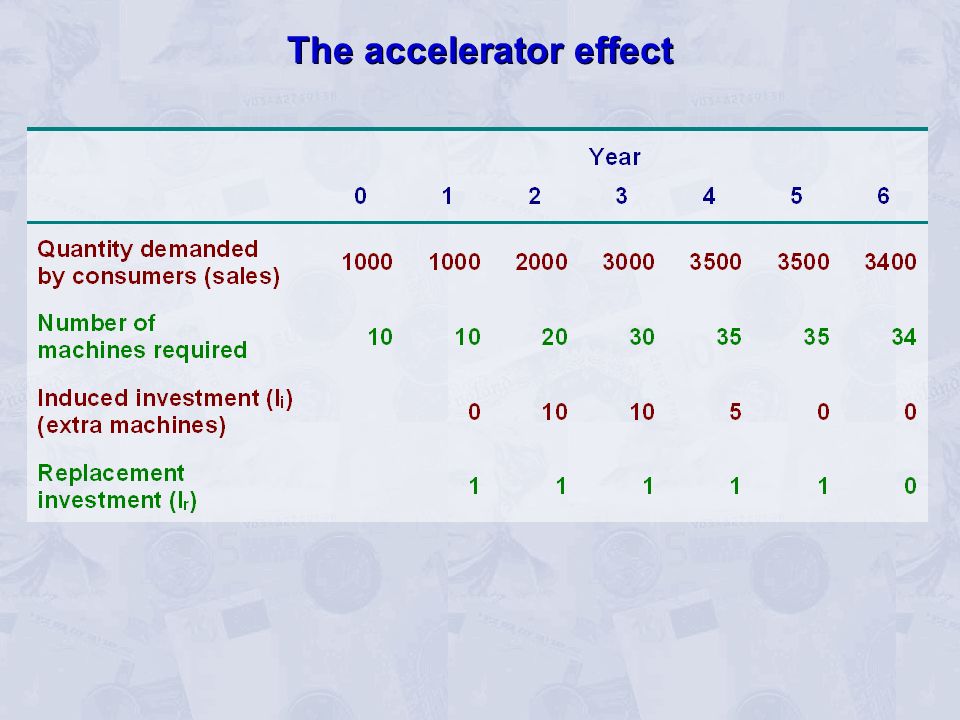
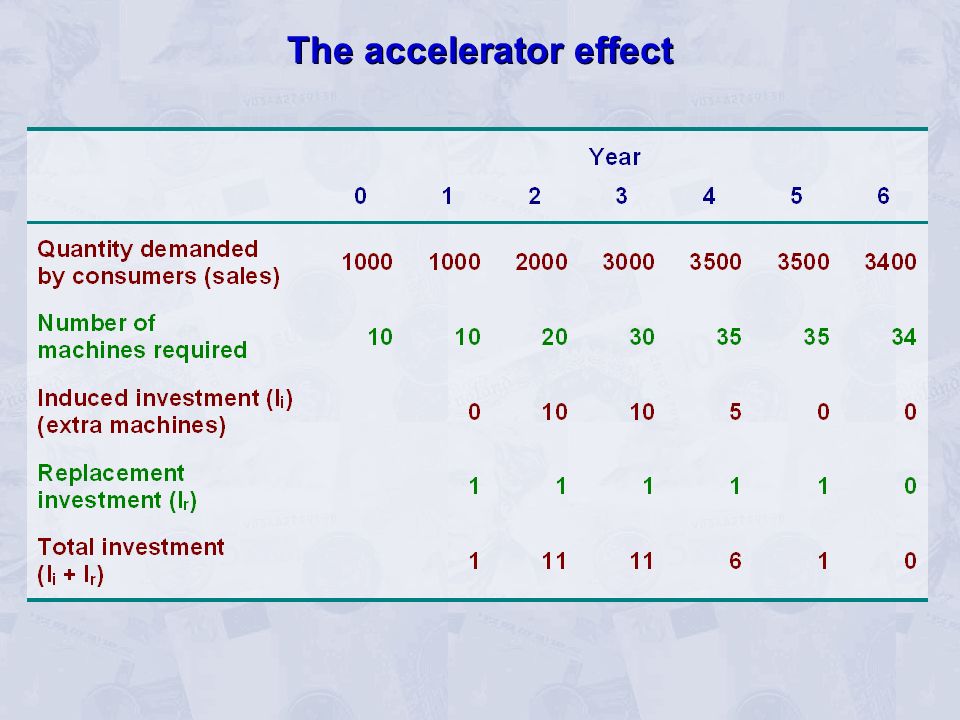
Keynesian Analysis of the Business Cycle The accelerator –changes in national income and induced investment –the accelerator effect The accelerator –changes in national income and induced investment –the accelerator effect

77
The accelerator effect

82
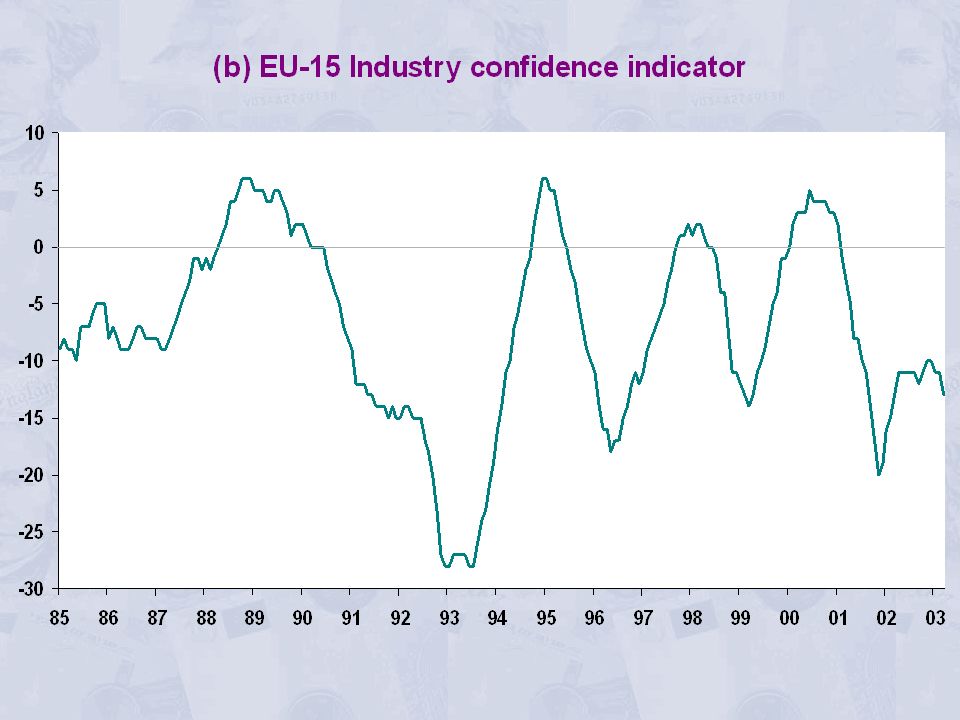
The accelerator –changes in national income and induced investment –the accelerator effect –the instability of investment The accelerator –changes in national income and induced investment –the accelerator effect –the instability of investment Keynesian Analysis of the Business Cycle

83
% (a) EU-15 Growth in GDP and business Investment GDP growth (%)
 EU-15 Growth in GDP and business Investment GDP growth (%)")
84
% (a) EU-15 Growth in GDP and business Investment GDP growth (%) Business investment (% change)
 EU-15 Growth in GDP and business Investment GDP growth (%) Business investment (% change)")
86
The accelerator –changes in national income and induced investment –the accelerator effect –the instability of investment The multiplier/accelerator interaction The accelerator –changes in national income and induced investment –the accelerator effect –the instability of investment The multiplier/accelerator interaction Keynesian Analysis of the Business Cycle

87
The accelerator –changes in national income and induced investment –the accelerator effect –the instability of investment The multiplier/accelerator interaction Fluctuations in stocks The accelerator –changes in national income and induced investment –the accelerator effect –the instability of investment The multiplier/accelerator interaction Fluctuations in stocks Keynesian Analysis of the Business Cycle

88
Determinants of the course of the business cycle –why do booms and recessions persist? time lags 'bandwagon' effects –why do booms and recessions end? ceilings and floors echo effects the accelerator random shocks changes in government policy Determinants of the course of the business cycle –why do booms and recessions persist? time lags 'bandwagon' effects –why do booms and recessions end? ceilings and floors echo effects the accelerator random shocks changes in government policy Keynesian Analysis of the Business Cycle

89
The Role of Fiscal Policy The purpose of fiscal policy –correcting a fundamental disequilibrium –fine tuning Deficits and surpluses –central government deficits and surpluses –public-sector deficits and surpluses –the PSNCR –the national debt The purpose of fiscal policy –correcting a fundamental disequilibrium –fine tuning Deficits and surpluses –central government deficits and surpluses –public-sector deficits and surpluses –the PSNCR –the national debt

90
UK public-sector borrowing Source: www.statistics.gov.uk (National Statistics): Series RURQ and YBHA
: Series RURQ and YBHA")
91
UK public-sector borrowing Source: www.statistics.gov.uk (National Statistics): Series RURQ and YBHA
: Series RURQ and YBHA")
92
UK public-sector borrowing Source: www.statistics.gov.uk (National Statistics): Series RURQ and YBHA
: Series RURQ and YBHA")
93
UK public-sector borrowing Source: www.statistics.gov.uk (National Statistics): Series RURQ and YBHA
: Series RURQ and YBHA")
94
General government deficits/surpluses and debt as % of GDP General government deficits/surpluses and debt as % of GDP

95
General government deficits/surpluses and debt as % of GDP General government deficits/surpluses and debt as % of GDP

96
The Role of Fiscal Policy The use of fiscal policy –automatic fiscal stabilisers –discretionary fiscal policy The use of fiscal policy –automatic fiscal stabilisers –discretionary fiscal policy

97
Effectiveness of Fiscal Policy Factors determining the effectiveness of fiscal policy –accuracy of forecasting –effect on J and W –effect of changes in J and W on national income –timing of the effects –effects on the various macro objectives Factors determining the effectiveness of fiscal policy –accuracy of forecasting –effect on J and W –effect of changes in J and W on national income –timing of the effects –effects on the various macro objectives

98
Effectiveness of Fiscal Policy Discretionary policy –problems of forecasting the magnitude of the effects effects of changes in government expenditure crowding out effects of changes in taxes size of the multiplier and accelerator effects random shocks –problems of timing and time lags various time lags policy may be destabilising Discretionary policy –problems of forecasting the magnitude of the effects effects of changes in government expenditure crowding out effects of changes in taxes size of the multiplier and accelerator effects random shocks –problems of timing and time lags various time lags policy may be destabilising

99
Fiscal policy: stabilising or destabilising? O Real national income Time 1 2 3 4 1 2 3 4 Path (a): no intervention
: no intervention.")
100
O Real national income Time 1 2 3 4 1 2 3 4 Path (a): no intervention Path (b): policy stabilises Fiscal policy: stabilising or destabilising?
: no intervention Path (b): policy stabilises Fiscal policy: stabilising or destabilising")
101
O Real national income Time 1 2 3 4 1 2 3 4 Path (a): no intervention Path (c): policy destabilises Path (b): policy stabilises Fiscal policy: stabilising or destabilising?
: no intervention Path (c): policy destabilises Path (b): policy stabilises Fiscal policy: stabilising or destabilising")
102
Effectiveness of Fiscal Policy Side-effects of discretionary policy –cost inflation –welfare and distributive justice –incentives A rules-based approach to fiscal policy –a 'steady-as-you-go' policy –the EU Stability and Growth Pact Side-effects of discretionary policy –cost inflation –welfare and distributive justice –incentives A rules-based approach to fiscal policy –a 'steady-as-you-go' policy –the EU Stability and Growth Pact

103
Getting budget deficits down

104
France

105
Getting budget deficits down France Germany

106
Getting budget deficits down France Germany Italy

107
Getting budget deficits down Spain France Germany Italy

108
Getting budget deficits down Spain France Germany Italy Belgium

109
Getting budget deficits down Spain France Germany Italy Netherlands Belgium

110
Effectiveness of Fiscal Policy Side-effects of discretionary policy –cost inflation –welfare and distributive justice –incentives A rules-based approach to fiscal policy –a 'steady-as-you-go' policy –the EU Stability and Growth Pact –UK Labour government's 'Golden Rule' Side-effects of discretionary policy –cost inflation –welfare and distributive justice –incentives A rules-based approach to fiscal policy –a 'steady-as-you-go' policy –the EU Stability and Growth Pact –UK Labour government's 'Golden Rule'

Similar presentations


 Adjusting inflationary gaps Stagflation A growing economy A role for stabilization policy.>")


