Download presentation
Presentation is loading. Please wait.

1
Application of Satellite Data to Protected Species Management and Bycatch Estimation By Chris Orphanides

2
Goals of Presentation 1)Provide a brief overview of the use of satellite-derived datasets in the NEFSC 2)Show how these data have been made accessible and used for Protected Species Bycatch Estimation and Management
Provide a brief overview of the use of satellite-derived datasets in the NEFSC 2)Show how these data have been made accessible and used for Protected Species Bycatch Estimation and Management")
3
Monitoring Ecosystem Primary Production With Satellite Ocean Color & Thermal Sensors Clouds ??? Cloud Probability Satellite Sensors: Good ecosystem monitoring method for this region J.O’Reilly, NMFS, NOAA

4
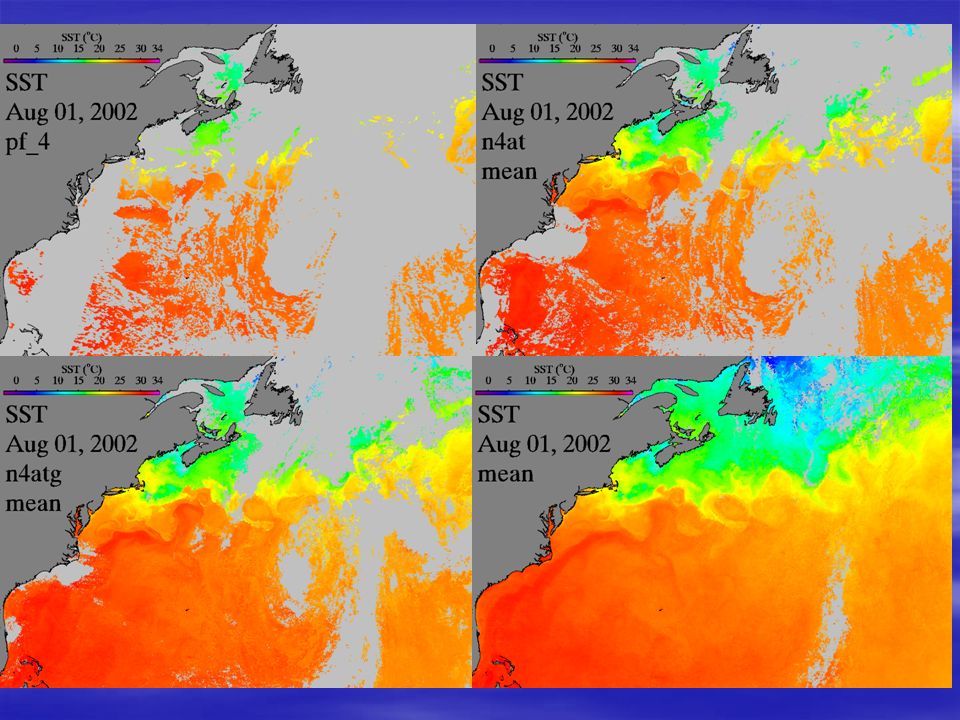
Sea Surface Temperature - Merged Product - SST derived from multiple satellites to remove clouds Sources include: Pathfinder (AVHRR), MODIS Aqua, MODIS Terra, and GOES Credit: J. O’Reilly, C. Orphanides, T. Ducas, and G.Wood

6
Oceanographic and Environmental Data Types Sea Surface Temperature (SST)Sea Surface Temperature (SST) Surface Chlorophyll aSurface Chlorophyll a Productivity ModelProductivity Model Oceanographic FrontsOceanographic Fronts Frontal Strength (gradient)Frontal Strength (gradient) Frontal DirectionFrontal Direction Bathymetric dataBathymetric data Bottom DepthBottom Depth Bottom SlopeBottom Slope
Sea Surface Temperature (SST) Surface Chlorophyll aSurface Chlorophyll a Productivity ModelProductivity Model Oceanographic FrontsOceanographic Fronts Frontal Strength (gradient)Frontal Strength (gradient) Frontal DirectionFrontal Direction Bathymetric dataBathymetric data Bottom DepthBottom Depth Bottom SlopeBottom Slope")
7
NEFSC Use of Satellite Data Some NEFSC Uses of Satellite Data: Definition of ecological sub-units Development of productivity model –Input into EMAX (Energy Modeling and Analysis eXercise) ecological modeling program –Input into ECoS (Eastern Continental Shelf Carbon Budget) Analysis of Atlantic Herring Fishery Proposed analysis of Northern Shrimp Fishery Protected Species Analysis
 ecological modeling program –Input into ECoS (Eastern Continental Shelf Carbon Budget) Analysis of Atlantic Herring Fishery Proposed analysis of Northern Shrimp Fishery Protected Species Analysis")
8
NEFSC PSB Use of Satellite Data Application of Satellite Data in the NEFSC Protected Species Branch : Development of tools to link satellite data with fisheries datasets Analysis of turtle bycatch in longlines Bycatch estimates of turtle bycatch in bottom trawl and scallop dredge fisheries Bycatch estimates of cetaceans in trawl fisheries Assisting in marine mammal abundance surveys Habitat investigations

9
Workflow – Applying Satellite Data to Fisheries Datasets 1.Download Satellite Data 2.Make composite satellite images (using IDL) 3.Convert Images to ArcGIS ready format (using IDL) 4.Read images into an ArcGIS raster format (with ArcGIS) 5.Set proper map projections (with ArcGIS) 6.Sample satellite data for fishing locations using custom tools
 3.Convert Images to ArcGIS ready format (using IDL) 4.Read images into an ArcGIS raster format (with ArcGIS) 5.Set proper map projections (with ArcGIS) 6.Sample satellite data for fishing locations using custom tools")
10
Tool Example – Retrieving Satellite Data for Fishing Locations Select Fishing Location Shapefile Default locations of Satellite Data provided Specify Desired Products

12
Retrieving Satellite Data for Fishing Areas (polygons) Polygons representing longline sets are plotted and overlaid onto satellite imagery or other imagery. The values within these polygons, representing temperature for example, are extracted. To the right are two polygons representing longlining sets. The four points in each polygon represent the begin set, end set, begin haul, and end haul locations.

13
New columns containing SST characteristics for each fishing area polygon Also retrieves percent of cloudy pixels

14
Fishing set from December 2, 2001 shown as a red polygon overlaid over a December 4, 2001 single- day SeaWiFS chlorophyll image. SeaWiFS chlorophyll characteristics for longline set on December 2nd of 2000. Close up of set sampled Image Source: NOAA CoastWatch Northeast Example of SeaWiFS Chlorophyll Image and a Corresponding Longline Set in December 2001

15
Resulting Data Set (using polygons representing sets) % Cloudy Pixels Mean Min Max Range Std. Dev. SST Chla Ocean Currents Depth For each longline set Plus the original data in the observer database such as number of lightsticks, set time and haul, fish caught, etc.

16
Northeast Variables Considered Latitude Longitude Day of Year Depth Bottom Slope Chlorophyll Temperature Frontal Strength Lunar Cycle Canyons Soak Time Watermass Wind-driven Ekman Transport

17
Variables important in distinguishing Northeast sets that caught loggerheads Latitude Longitude Day of Year Depth Bottom Slope Chlorophyll Temperature Frontal Strength Lunar Cycle Canyons Soak Time Watermass Wind-driven Ekman Transport

18
Apparent temperature preference between 18 and 24 o C Occupied shallower waters than the average longline set in the NEC region (500 - 1200 m) Preference for the shelf break north of 39 latitude, particularly in the fall Primarily associated with northern edges of warm core rings and the shelf/slope front Preference for fishing areas over submarine canyons Showed no distinction from longline sets with respect to bottom slope, chlorophyll levels, or perceived frontal strength Majority of loggerhead population is likely concentrated along the mid- continental shelf, inshore and south of the majority of longlining effort Longline Turtle Bycatch Analysis
 Preference for the shelf break north of 39 latitude, particularly in the fall Primarily associated with northern edges of warm core rings and the shelf/slope front Preference for fishing areas over submarine canyons Showed no distinction from longline sets with respect to bottom slope, chlorophyll levels, or perceived frontal strength Majority of loggerhead population is likely concentrated along the mid- continental shelf, inshore and south of the majority of longlining effort Longline Turtle Bycatch Analysis")
20
Loggerhead Bottom Trawl Bycatch Modeling October Loggerhead Bycatch Loggerhead distribution shifts with seasonal temperature changes SST has been an important factor in modeling loggerhead bycatch JPL Climatology – Oct 15JPL Climatology – Dec 13 December Loggerhead Bycatch Bycatch estimate modeling by Kimberly Murray

21
Sea Scallop Dredge Turtle Bycatch Modeling Image courtesy of Kimberly Murray

22
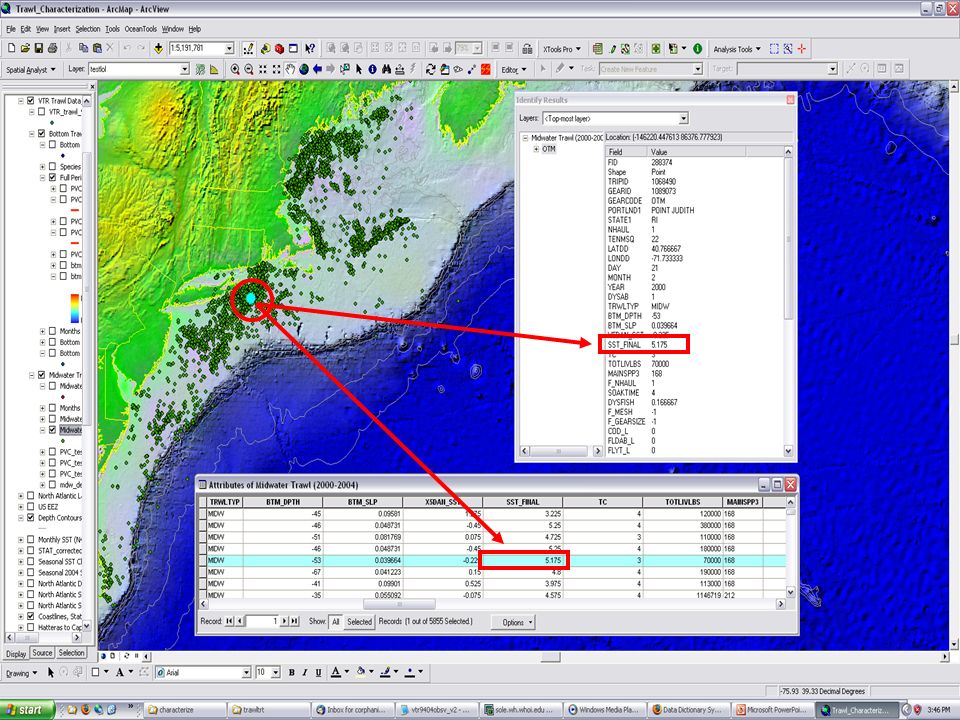
Marine Mammal Midwater Trawl Bycatch Modeling Images courtesy of Debra Palka Model in development found bottom slope to be a significant factor for predicting bycatch of cetaceans in mid-water trawl fisheries. Areas of steep bottom slope had higher rates of bycatch, and likely serve as a proxy for other oceanographic factors.

23
Common Dolphin and Bottom Depth Pilot Whales and bottom slope Marine Mammal Bottom Trawl Bycatch Modeling Pilot Whale bycatch in the trawl fishery Model in development found bottom slope to be a significant factor for predicting bycatch. Common Dolphin bycatch in the trawl fishery Model in development found bottom depth to be a significant factor for predicting bycatch. White-sided dolphin bycatch in the trawl fishery Model in development found SST and Depth to be a significant factor for predicting bycatch. White-sided Dolphin and SST SST Composite from 3/3/2004

24
Marine Mammal Survey Data Maps of SST used to guide shipboard marine mammal surveys. Primarily looking for frontal regions Points show track of ship

25
Marine Mammal Survey Data Identification of unidentified animals in abundance survey using SST Image courtesy of Debra Palka Unidentified dolphin likely two species, common dolphin and possibly bottlenose dolphins Unidentified Dolphin Common Dolphin Bottlenose Dolphin

26
Other Current and Future Projects Applying Satellite Data Examining possible link between sea turtle bycatch and high inter-annual variability in summer chlorophyll off the coast of New Jersey Examining sea turtle bycatch distribution across multiple fisheries relative to a number of environmental variables (including SST, chlorophyll, oceanographic fronts, bathymetric features, bottom temps, water column stratification, etc.) Distribution of satellite tagged leatherbacks relative to oceanographic variables Harbor porpoise gillnet bycatch model
 Distribution of satellite tagged leatherbacks relative to oceanographic variables Harbor porpoise gillnet bycatch model")
27
Summary 1)Satellite data is being used effectively in the NEFSC, particularly with protected species. However, it could be made much more user-friendly. 2)Due to dynamic ocean and cloud cover, downloadable 3 and 5 day satellite data composites would be very useful. 3)Providing data in a GIS-ready format would facilitate use by fisheries scientists. 4)Providing tool, ideally online, for retrieving data from satellite data from time series in a batch mode for fishing locations and areas
Due to dynamic ocean and cloud cover, downloadable 3 and 5 day satellite data composites would be very useful. 3)Providing data in a GIS-ready format would facilitate use by fisheries scientists. 4)Providing tool, ideally online, for retrieving data from satellite data from time series in a batch mode for fishing locations and areas.")
28
OBIS-SeaMAP Project Developing online mapping capabilities, mapping marine data over satellite data Ocean Biogeographic Information System - Spatial Ecological Analysis of Megavertebrate Populations Source: http://seamap.env.duke.edu/ Example – Satellite tracked sea turtles over 8- day chlorophyll image

29
Satellite Tracking and Analysis (STAT) Tool SOURCES: Published in Marine Ecological Progress Series by M.S. Coyne and B.J. Godley (www.int-res.com/articles/feature/m301p001.pdf) www.int-res.com/articles/feature/m301p001.pdf More information can be found on seaturtle.org and specifically at: www.seaturtle.org/STAT.pdf www.seaturtle.org/STAT.pdf STAT is an online tool for linking satellite data to satellite-tagged marine animals In their words: ‘An integrated system for archiving, analyzing, and mapping, marine vertebrate satellite tracking data’

30
THE END Special Thanks to: Cara Wilson for inviting me to present, and to Jay O’Reilly, Debra Palka, Kimberly Murray, Marjorie Rossman for their contributions to this presentation.

31
Loggerhead Bycatch Modeling PSB is also investigating loggerhead bycatch relative to oceanographic fronts

32
Leatherback Migration Turtles tagged by Molly Lutcavage, et al.

33
Graph based on observer data from 1990-2000 2001 sets that caught loggerheads from days 248 to 256 2001 day 251 GOES SST 5-day composite

Similar presentations


 for GIS Based Fisheries Decision.>")
 larvae in the Gulf of Mexico.>")


 were determined from seasonally 1998-2002 IMECOCAL surveys and satellite data off Baja.>")

