Download presentation
Presentation is loading. Please wait.

1
I. Introduction and Red Line Education for Data-unlimited Science

2
ResearchEducation For the first time in the history of biology students can work with the same data at the same time and with the same tools as research scientists. Educational Challenge Context of scientific discovery

4
50-70 46 28 25 13 14 9 150-300 Monocots Dicots Time (million years) Present 204060 Oryza (rice) Avena (oats) Hordeum (barley) Triticum (wheat) Setaria (foxtail millet) Pennisetum (pearl millet) Sorghum Zea (maize) Arabidopsis Brachypodium Glycine max (soy) 2,500 Mb 750 Mb 20,000 Mb 270 Mb 430 Mb 145 Mb 1,115 Mb ?? Mb 5,200 Mb >20,000 Mb ?? Mb Plant Genomes Vary Widely in Size = Genome duplication event

5
Genome Duplication/Factionation

6
DNA Subway Concepts (Big Ideas) Genomes are complex and dynamic (queer). DNA sequence is information. DNA sequence is biological identity. Gene annotation adds meaning to DNA sequence. Concept of gene continues to evolve. A genome is more than genes.

7
Insights from Genomics in Education Washington University, June 16-19, 2009 44 participants from three worlds and three kingdoms Bioinformatics: Students have limited patience for pure computer work and want a wet bench hook. Student-scientists partnerships: Someone has to care about the data generated by students. Students as co-investigators: Projects should potentially lead to publication. Scale: Need to move from individual experiments to course-based and distributed research projects.

8
Walk or…

9
Ride…

10
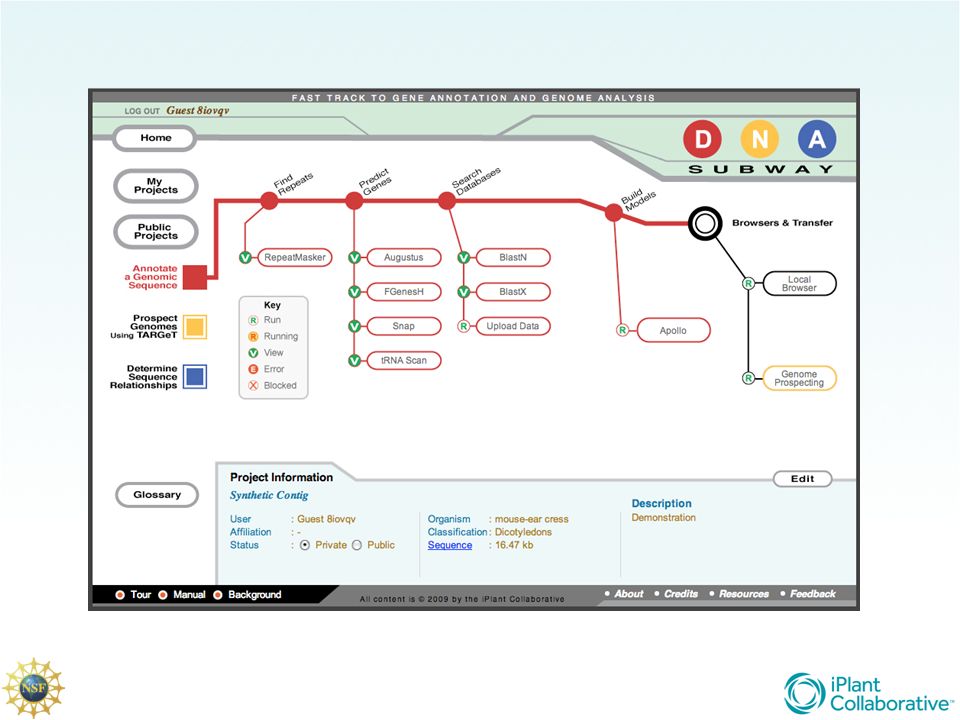
DNA Subway an educational Discovery Environment Simplified bioinformatics workflows Developed with 25 collaborators at 11 institutions Since March 2010 launch: 2,905 registered users 52,591 visits, 24,593 unique visits Red Line: predict and annotate genes in <150 kb Yellow Line: identify homologs in sequenced genomes Blue Line: analyze DNA barcodes and build gene trees Green Line: align and analyze RNA-seq data (coming)
")
11
Red Line Learning Questions What is a gene and how does it relate to DNA sequence? What are the components of genes? How does a gene relate to the central dogma of molecular biology: DNA <> RNA > Protein? How does a gene encode a protein? How is the mathematical evidence used to predict genes? How does biological evidence (from RNA and proteins) confirm gene predictions?
 confirm gene predictions .")
12
Genes as Beads on a String

13
http://www.ncbi.nlm.nih.gov/genome/guide/human/ Morgan’s Beads on a String

14
Human Globin Locus on Chromosome 11 Is that really all there is?

15
Human Genome Insights (ENCODE) Majority of genome is transcribed ~50% transposons ~25% protein coding genes/1.3% exons ~23,700 protein coding genes ~160,000 transcripts Average Gene ~ 36,000 bp 7 exons @ ~ 300 bp 6 introns @ ~5,700 bp 7 alternatively spliced products (95% of genes)
 Majority of genome is transcribed ~50% transposons ~25% protein coding genes/1.3% exons ~23,700 protein coding genes ~160,000 transcripts Average Gene ~ 36,000 bp 7 ~ 300 bp 6 ~5,700 bp 7 alternatively spliced products (95% of genes)")
16
Piano Keys? Keys dynamically placed by real data (features, coordinates)
")
17
This map can allow student to appreciate some of the complexity of the genome. Clicking on links to sequence confirms a relationship between something called a gene and a DNA sequence. What is a gene is and how does it relate to DNA ?

19
Submit Sequence Identify & Mask Repeats Predict Genes Search Datasets Build Gene Models Prospect Genomes Compare Annotations (Optional) Load User Data Predict Function Gene Annotation Workflow
 Load User Data Predict Function Gene Annotation Workflow")
22
Brent Buckner, Ph.D. Truman State University “I have found that students are overwhelmed by their first introduction to genome sequences viewed on a genome browser. Students who used DNA Subway needed little or no guidance when they moved on to use MaizeGDB and had an easier time transitioning to genomes depicted in different genome browsers.”

23
DNA Subway Case Study Brent Buckner, Ph.D., Truman State University Sophomore genetics class, spring 2010 and 2011 – 70 students used Red Line to annotate 3.7 mbp of maize genome – 12 hours effort, each student annotated 100 kb – Follow-up research projects by 7 undergraduates: Compared syntenic regions of maize Chr. 6 and sorghum 65 hours effort, each student annotated 1 million bp MaizeGDB, MaizeSequence.org, InterProScan, CoGE, PlexDB, Circos Sophomore genetic class, spring 2012 – 19 students used Red Line to visualize next-gen RNA-Seq data to investigate presence/absence variation (PAV) in maize – 12 hours effort, each student group annotated 100 kb and then imported next-gen RNA-Seq data from 5 different tissues in 30 maize inbred lines for a gene that they had previously shown exhibits PAV
 in maize – 12 hours effort, each student group annotated 100 kb and then imported next-gen RNA-Seq data from 5 different tissues in 30 maize inbred lines for a gene that they had previously shown exhibits PAV.")
24
Judy Brusslan, Ph.D. CSU, Long Beach “When I used the Red Line exercise in six lab sections of my General Genetics class this Fall, it went smoothly and best of all, there was a mass “Ah-ha” moment when the results of the gene prediction programs were displayed on the Genome Browser. The use of BLASTX and BLASTN within the Red Line allowed the students to visualize the different outputs and understand the value of sequenced cDNAs for gene prediction.”

Similar presentations


 www.yandell-lab.org iPlant: Josh Stein (CSHL) Matt Vaughn.>")


 Genetic information is stored in our DNA (~ 3 billion bp) The DNA of a.>")


 www.yandell-lab.org iPlant: Josh Stein (CSHL) Matt Vaughn.>")


