Download presentation
Presentation is loading. Please wait.

1
What is the Purpose of Health Class Provide accurate health information in such a way as to influence people to change attitudes so that they take positive action about their health. Provide accurate health information in such a way as to influence people to change attitudes so that they take positive action about their health.

2
What is Health? Combination of your physical, mental/ emotional, and social well-being. Combination of your physical, mental/ emotional, and social well-being.

3
3 Elements of Health Physical- the way the parts and systems of your body work together. Physical- the way the parts and systems of your body work together. Mental/ Emotional- feelings about yourself, how well you relate to others, and how well you meet the demands of daily life. Mental/ Emotional- feelings about yourself, how well you relate to others, and how well you meet the demands of daily life. Social- the way you get along with others; the ability to make and keep friends; showing respect for others Social- the way you get along with others; the ability to make and keep friends; showing respect for others

4
Health Continuum Your health is constantly changing

5
Influences on Health 1. Heredity- all the traits and properties that are passed along biologically from both parents to child.

6
2. Environment- the sum total of your surroundings- your family, where you grew up, where you live, all your experiences Physical Physical Social Social Cultural Cultural

7
3. Behavior- your choices and habits. Behavior can offset all other risk factors.

8
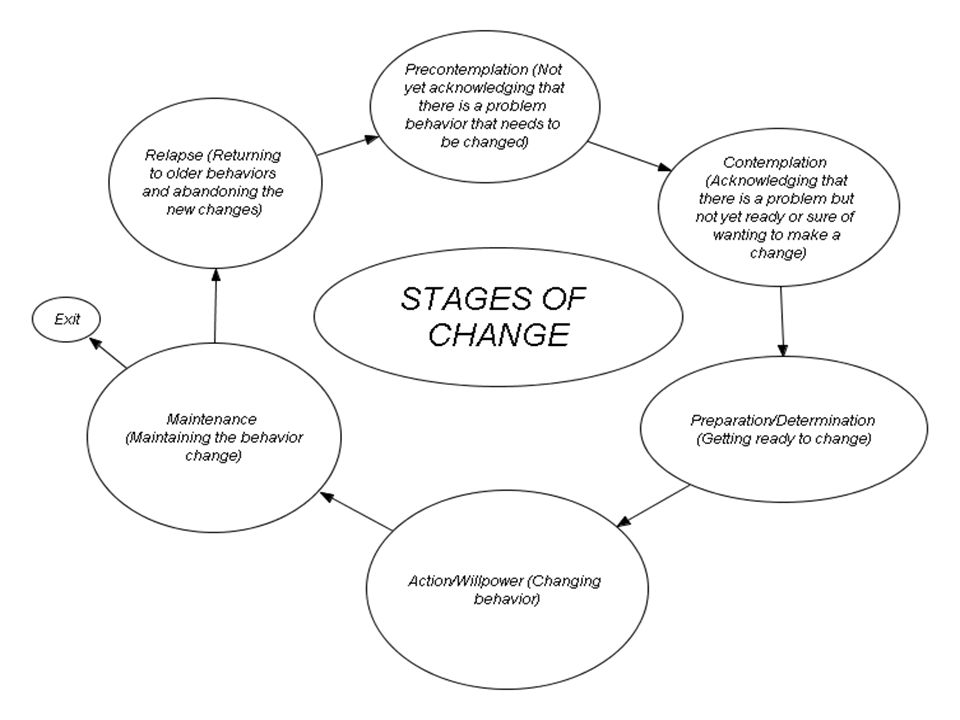
The stages of change are: Precontemplation (Not yet acknowledging that there is a problem behavior that needs to be changed) Precontemplation (Not yet acknowledging that there is a problem behavior that needs to be changed) Contemplation (Acknowledging that there is a problem but not yet ready or sure of wanting to make a change) Contemplation (Acknowledging that there is a problem but not yet ready or sure of wanting to make a change) Preparation/Determination (Getting ready to change) Preparation/Determination (Getting ready to change) Action/Willpower (Changing behavior) Action/Willpower (Changing behavior) Maintenance (Maintaining the behavior change) and Maintenance (Maintaining the behavior change) and Relapse (Returning to older behaviors and abandoning the new changes) Relapse (Returning to older behaviors and abandoning the new changes)
 Precontemplation (Not yet acknowledging that there is a problem behavior that needs to be changed) Contemplation (Acknowledging that there is a problem but not yet ready or sure of wanting to make a change) Contemplation (Acknowledging that there is a problem but not yet ready or sure of wanting to make a change) Preparation/Determination (Getting ready to change) Preparation/Determination (Getting ready to change) Action/Willpower (Changing behavior) Action/Willpower (Changing behavior) Maintenance (Maintaining the behavior change) and Maintenance (Maintaining the behavior change) and Relapse (Returning to older behaviors and abandoning the new changes) Relapse (Returning to older behaviors and abandoning the new changes)")
9
Do you want to be better? Something has to change in order to get better. Something has to change in order to get better. Failure to change is often stubbornness that comes from an unwillingness to learn or inability to realize you’re not perfect. There can’t be progress without change. Always be progressing. Failure to change is often stubbornness that comes from an unwillingness to learn or inability to realize you’re not perfect. There can’t be progress without change. Always be progressing.

11
Risk Factors- Behaviors that contribute to unintentional and intentional injuries Tobacco use Tobacco use Alcohol and other drug use Alcohol and other drug use Sexual behaviors Sexual behaviors Unhealthy eating behaviors Unhealthy eating behaviors Physical inactivity Physical inactivity

12
Cumulative Risk- risks that increase gradually and may add up to a total that is greater than expected Ex.- Driving without a seat belt, smoking, drinking and driving

13
Freshman Survey Results Current Alcohol Use- ____% Current Alcohol Use- ____% Lifetime Intoxication- ____% Lifetime Intoxication- ____% Lifetime Tobacco Use- ____% Lifetime Tobacco Use- ____% Lifetime Marijuana Use- ____% Lifetime Marijuana Use- ____% Lifetime Recreational Drugs- ____% Lifetime Recreational Drugs- ____% Sexually Active- _____% Sexually Active- _____% Parent Divorced- _____% Parent Divorced- _____% 24 26 24 16 30 33

16
Leading Causes of Death Among Persons Aged 10 – 24 Years in the United States

17
Leading Causes of Death Among Persons Aged 25 Years and Older in the United States

18
Impact of Sexual Behaviors 831,000 pregnancies occur each year among persons aged 15 – 19 years 831,000 pregnancies occur each year among persons aged 15 – 19 years 9.1 million cases of sexually transmitted diseases occur each year among persons aged 15 – 24 years 9.1 million cases of sexually transmitted diseases occur each year among persons aged 15 – 24 years An estimated 4,842 cases of HIV/AIDS occur annually among persons aged 15 – 24 years An estimated 4,842 cases of HIV/AIDS occur annually among persons aged 15 – 24 years

19
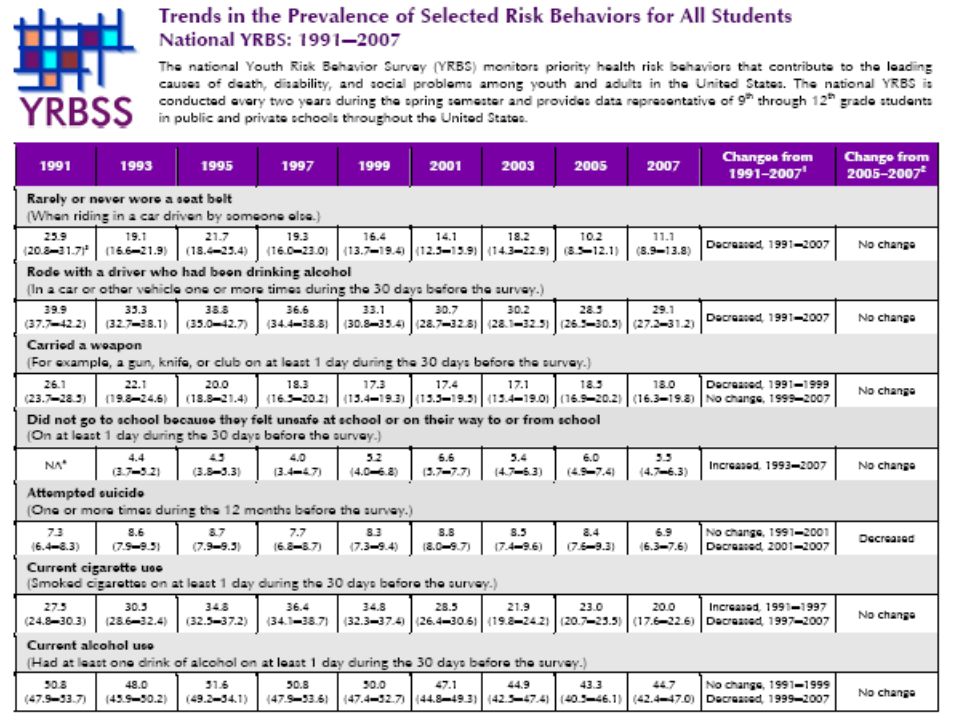
* One or more times during the 30 days preceding the survey 1 Significant linear decrease, P <.05 National Youth Risk Behavior Surveys, 1991 – 2005 Percentage of High School Students Who Rode in a Car or Other Vehicle Driven by Someone Who Had Been Drinking Alcohol,* 1991 – 2005

20
* One or more times during the 30 days preceding the survey 1 Significant linear decrease and quadratic change, P <.05 National Youth Risk Behavior Surveys, 1991 – 2005 Percentage of High School Students Who Drove a Car or Other Vehicle When They Had Been Drinking Alcohol,* 1991 – 2005

21
Percentage of High School Students Who Were in a Physical Fight,* 1991 – 2005 * One or more times during the 12 months preceding the survey 1 Significant linear decrease and quadratic change, P <.05 National Youth Risk Behavior Surveys, 1991 – 2005

22
Percentage of High School Students Who Experienced Dating Violence,* 1999 – 2005 * Hit, slapped, or physically hurt on purpose by a boyfriend or girlfriend during the 12 months preceding the survey 1 No significant change over time National Youth Risk Behavior Surveys, 1999 – 2005

23
Percentage of High School Students Who Were Ever Physically Forced to Have Sexual Intercourse,* 2001 – 2005 * When they did not want to 1 No significant change over time National Youth Risk Behavior Surveys, 2001 – 2005

24
Percentage of High School Students Who Seriously Considered Attempting Suicide,* 1991 – 2005 * During the 12 months preceding the survey 1 Significant linear decrease and quadratic change, P <.05 National Youth Risk Behavior Surveys, 1991 – 2005

25
Percentage of High School Students Who Reported Lifetime Cigarette Use,* 1991 – 2005 * Ever tried cigarette smoking, even one or two puffs 1 Significant linear decrease and quadratic change, P <.05 National Youth Risk Behavior Surveys, 1991 – 2005

26
Percentage of High School Students Who Reported Lifetime Daily Cigarette Use,* 2001 – 2005 * Ever smoked at least one cigarette every day for 30 days 1 Significant linear decrease, P <.05 National Youth Risk Behavior Surveys, 2001 – 2005

27
Percentage of High School Students Who Reported Lifetime Alcohol Use,* 1991 – 2005 National Youth Risk Behavior Surveys, 1991 – 2005 * Had at least one drink of alcohol on ≥ 1 days during their life 1 Significant linear decrease and quadratic change, P <.05

28
Percentage of High School Students Who Reported Current Alcohol Use,* 1991 – 2005 * Had at least 1 drink of alcohol on 1 of the 30 days preceding the survey 1 Significant linear decrease and quadratic change, P <.05 National Youth Risk Behavior Surveys, 1991 – 2005

29
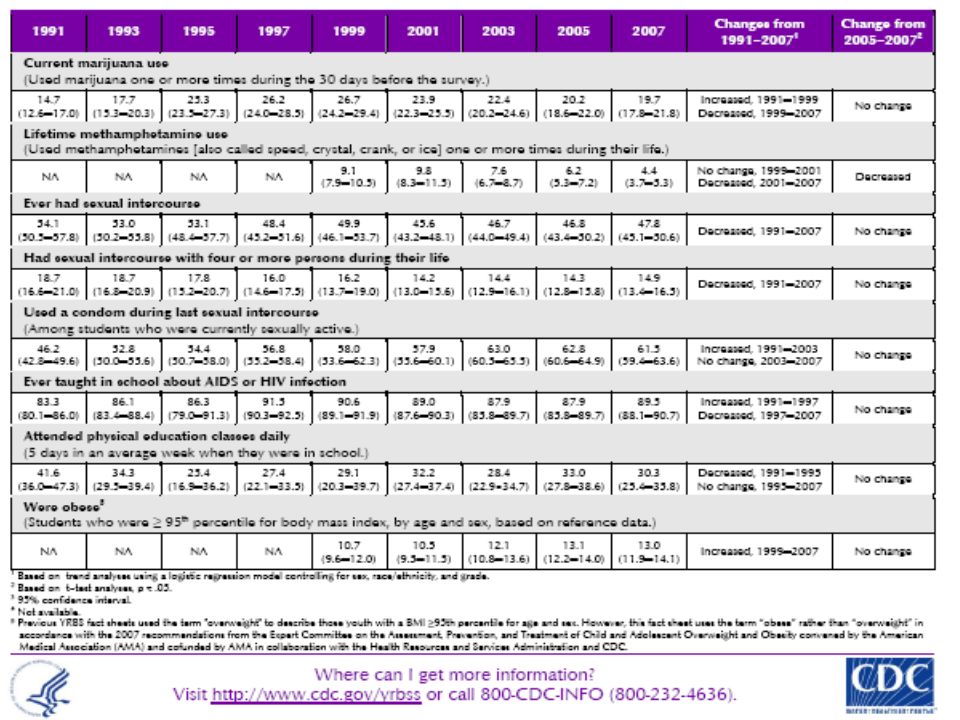
Percentage of High School Students Who Reported Lifetime Marijuana Use,* 1991 – 2005 * Used marijuana one or more times during their life 1 Significant linear increase and quadratic change, P <.05 National Youth Risk Behavior Surveys, 1991 – 2005

30
Percentage of High School Students Who Were Currently Sexually Active,* 1991 – 2005 National Youth Risk Behavior Surveys, 1991 – 2005 * Had sexual intercourse with ≥ 1 persons during the 3 months preceding the survey 1 Significant linear decrease, P <.05

31
Percentage of High School Students Who Played Video or Computer Games or Used a Computer for ≥ 3 Hours/Day,* by Sex** and Race/Ethnicity,*** 2005 * On an average school day, for something that is not school work ** M > F *** B > W, H National Youth Risk Behavior Survey, 2005

32
Percentage of High School Students Who Watched ≥ 3 Hours/Day of Television,* by Sex and Race/Ethnicity,** 2005 * On an average school day ** B > H > W National Youth Risk Behavior Survey, 2005

33
Percentage of High School Students Who Were At Risk For Becoming Overweight,* by Sex and Race/Ethnicity,** 2005 * Students who were > 85 th percentile but < 95 th percentile for body mass index, by age and sex, based on reference data ** B > W, H National Youth Risk Behavior Survey, 2005

34
Freshman Survey Results Lifetime Alcohol Use- 65% Lifetime Alcohol Use- 65% Lifetime Intoxication- 26% Lifetime Intoxication- 26% Lifetime Tobacco Use- 24% Lifetime Tobacco Use- 24% Lifetime Marijuana Use- 24% Lifetime Marijuana Use- 24% Lifetime Recreational Drugs- 16% Lifetime Recreational Drugs- 16% Sexually Active- 30% Sexually Active- 30% Parent Divorced- 33% Parent Divorced- 33%

35
The stages of change are: Precontemplation (Not yet acknowledging that there is a problem behavior that needs to be changed) Precontemplation (Not yet acknowledging that there is a problem behavior that needs to be changed) Contemplation (Acknowledging that there is a problem but not yet ready or sure of wanting to make a change) Contemplation (Acknowledging that there is a problem but not yet ready or sure of wanting to make a change) Preparation/Determination (Getting ready to change) Preparation/Determination (Getting ready to change) Action/Willpower (Changing behavior) Action/Willpower (Changing behavior) Maintenance (Maintaining the behavior change) and Maintenance (Maintaining the behavior change) and Relapse (Returning to older behaviors and abandoning the new changes) Relapse (Returning to older behaviors and abandoning the new changes)
 Precontemplation (Not yet acknowledging that there is a problem behavior that needs to be changed) Contemplation (Acknowledging that there is a problem but not yet ready or sure of wanting to make a change) Contemplation (Acknowledging that there is a problem but not yet ready or sure of wanting to make a change) Preparation/Determination (Getting ready to change) Preparation/Determination (Getting ready to change) Action/Willpower (Changing behavior) Action/Willpower (Changing behavior) Maintenance (Maintaining the behavior change) and Maintenance (Maintaining the behavior change) and Relapse (Returning to older behaviors and abandoning the new changes) Relapse (Returning to older behaviors and abandoning the new changes)")
36
Do you want to be better? Something has to change in order to get better. Something has to change in order to get better. Failure to change is often stubbornness that comes from an unwillingness to learn or inability to realize you’re not perfect. There can’t be progress without change. Always be progressing. Failure to change is often stubbornness that comes from an unwillingness to learn or inability to realize you’re not perfect. There can’t be progress without change. Always be progressing.

Similar presentations


 Results: North Carolina.>")


