Download presentation
Presentation is loading. Please wait.

1
Gautam Sood Jeewanjyot Department of Sociology and Social Anthropology, Punjabi University, Patiala

2
Population of Punjab = 2,77,43,338 Punjab ranks 15 th in terms of Population Total Population Males = 1, 46, 39465 (52.82%) Total Population Females = 13103873 (47.17%) Total Population Rural = 1,73,44,192 (62.52%) Total Population Urban = 1,03,99,146 (37.48%) Total Population Rural Males = 90,93,476 (52.42%) Total Population Rural Females = 8250716 (47.58%) Total Population Urban Males = 5545989 (53.33%) Total Population Urban Females =4853157 (46.66%)
 Total Population Females = (47.17%) Total Population Rural = 1,73,44,192 (62.52%) Total Population Urban = 1,03,99,146 (37.48%) Total Population Rural Males = 90,93,476 (52.42%) Total Population Rural Females = (47.58%) Total Population Urban Males = (53.33%) Total Population Urban Females = (46.66%)")
3
Age GroupTotal PopulationRural PopulationUrban Population TotalMaleFemaleTotalMaleFemaleTotalMaleFemale Total27743338146394651310387317344192909347682507161039914655459894853157 5-92368019130168210663371507022827905679117860997473777387220 10-142583402144553011378721668828931366737462914574514164400410 15-19281768315701801247503181442710038318105961003256566349436907 20-2427766361465531131110517068338887398180941069803576792493011 25-2924638611270405119345614554567381967172601008405532209476196 30-342116539108253310340061263506636268627238853033446265406768 35-39198907110108629782091202842604249598593786229406613379616 40-49 3376240172734316488972067586105148910160971308654675854632800 50-592211019114950910615101319003681659637344892016467850424166 60-6917161788552898608891150840567649583191565338287640277698 70-79770138402323367815532089280485251604238049121838116211 80+ 3795011860501934512747811358231389581047205022754493 Age not stated4152222272192502961015833137771191264395473 15-5917751049927636384746861082965356044315225222692139636719323249464 60+2865817144366214221551957710983957973753908107459705448402 Source: Census India, 2011

4
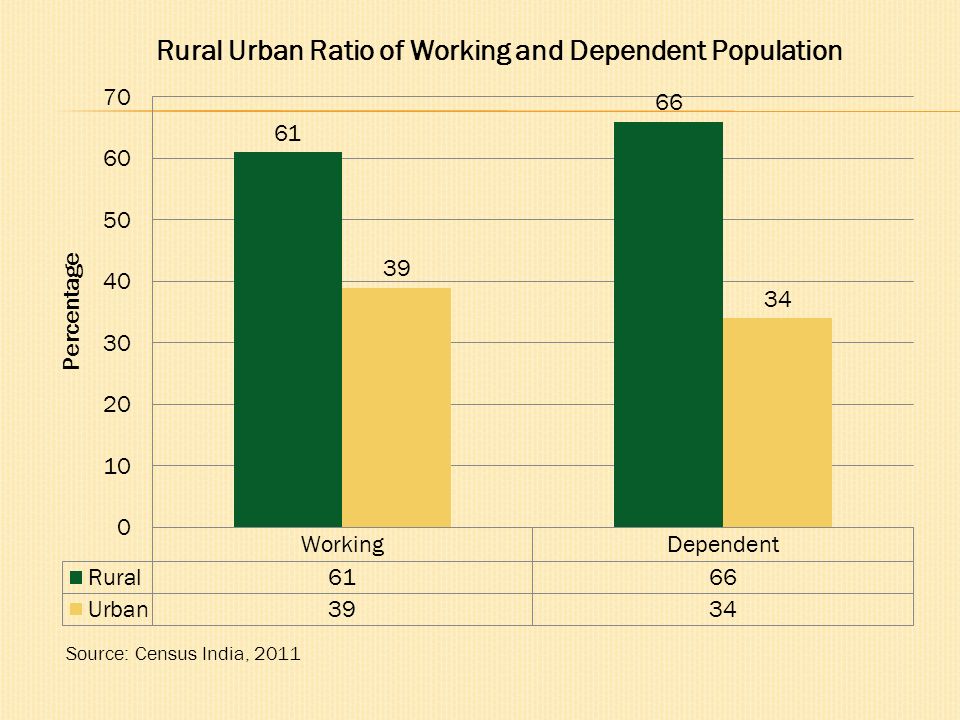
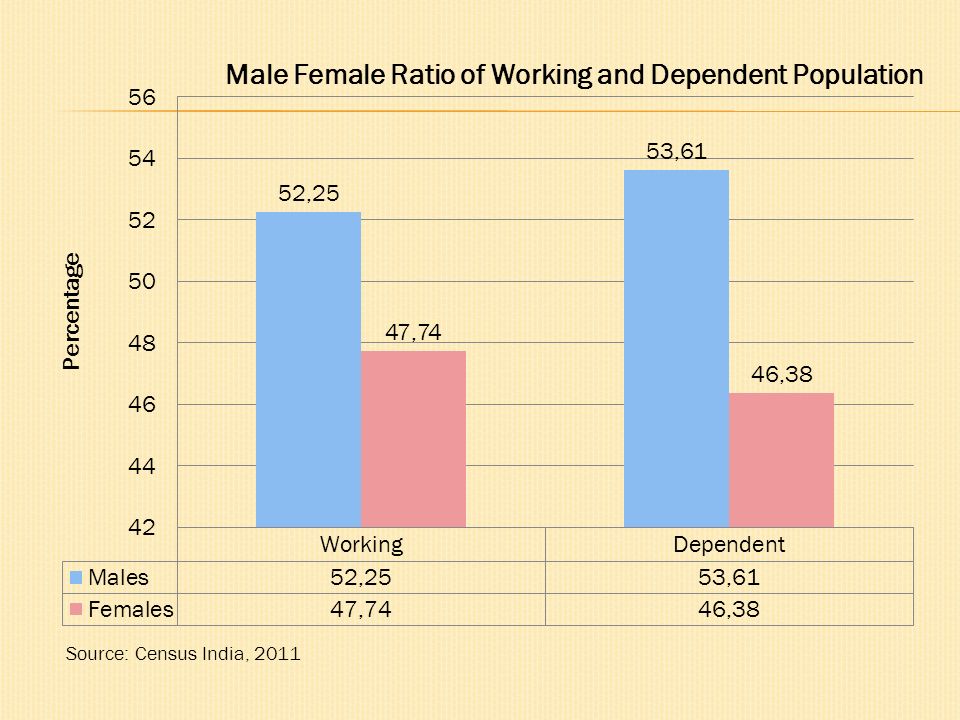
Age group with the Highest Population (Males, Females, Rural, Urban) = 40-49 Age group with the Lowest Population (Males, Females, Rural, Urban) = 80+ *Total Working Population = 17751049 Rural: 10829653Males: 92,76,363 Urban: 6921396Females: 84,74,686) **Dependent Population= 7817238 Rural: 5133560Males: 41,90,874 Urban: 2683678Females: 36,26,364 Rural Urban Ratio of Working Population = 61: 39 Rural Urban Ratio of Dependent Population = 66 : 34 Male Female Ratio of Working Population = 52.25 : 47.74 Male Female Ratio of Dependent Population =53.61 : 46.38 * Age Group 15-59 **Age Group 05-14 and 60+; Excluding age group 0-4 and those who have not stated their age. Source: Census India, 2011

7
Persons who have worked for the major part of the reference period (i.e. 6 months or more) Those workers who had not worked for the major part of the reference period (i.e. less than 6 months) are termed as Marginal Workers. A person who did not work at all during the reference period is treated as non-worker. The non-workers broadly constitute students, dependents, pensioners, beggars, vagrants, prostitutes, persons with unidentified source of income, Rentiers, Inmates of Jails, mental or charitable institutions and persons seeking/ available for work. Main Workers Marginal Workers Non Workers
 Those workers who had not worked for the major part of the reference period (i.e. less than 6 months) are termed as Marginal Workers. A person who did not work at all during the reference period is treated as non-worker. The non-workers broadly constitute students, dependents, pensioners, beggars, vagrants, prostitutes, persons with unidentified source of income, Rentiers, Inmates of Jails, mental or charitable institutions and persons seeking/ available for work. Main Workers Marginal Workers Non Workers.")
8
Person is engaged in cultivation of land owned or held from Government or held from private persons or institutions for payment in money, kind or share. Cultivation includes effective supervision or direction in cultivation. A person who has given out her/his land to another person or persons or institution(s) for cultivation for money, kind or share of crop and who does not even supervise or direct cultivation of land, is not treated as cultivator. Similarly, a person working on another person's land for wages in cash or kind or a combination of both (agricultural labourer) is not treated as cultivator. Cultivation does not include the following plantation crops - tea, coffee, rubber, coconut and betel-nuts (areca). A person who works on another person's land for wages in money or kind or share is regarded as an agricultural labourer. An agricultural labourer has no right of lease or contract on land on which she/he works. Household Industry is defined as an industry conducted by one or more members of the household at home or within the village in rural areas and only within the precincts of the house where the household lives in urban areas. All workers, i.e., those who have been engaged in some economic activity during the last one year, but are not cultivators or agricultural labourers or in Household Industry, are 'Other Workers(OW)'. The type of workers that come under this category of 'OW' include all government servants, municipal employees, teachers, factory workers, plantation workers, those engaged in trade, commerce, business, transport banking, mining, construction, political or social work, priests, entertainment artists, etc. Cultivator: Agricultural Labourers Household Industry Workers Others Source: Census India, 2011
 for cultivation for money, kind or share of crop and who does not even supervise or direct cultivation of land, is not treated as cultivator. Similarly, a person working on another person s land for wages in cash or kind or a combination of both (agricultural labourer) is not treated as cultivator. Cultivation does not include the following plantation crops - tea, coffee, rubber, coconut and betel-nuts (areca). A person who works on another person s land for wages in money or kind or share is regarded as an agricultural labourer. An agricultural labourer has no right of lease or contract on land on which she/he works. Household Industry is defined as an industry conducted by one or more members of the household at home or within the village in rural areas and only within the precincts of the house where the household lives in urban areas. All workers, i.e., those who have been engaged in some economic activity during the last one year, but are not cultivators or agricultural labourers or in Household Industry, are Other Workers(OW) . The type of workers that come under this category of OW include all government servants, municipal employees, teachers, factory workers, plantation workers, those engaged in trade, commerce, business, transport banking, mining, construction, political or social work, priests, entertainment artists, etc. Cultivator: Agricultural Labourers Household Industry Workers Others Source: Census India,")
9
Population of Punjab Main WorkersMarginal WorkersNon-workers Less than 3 months 3-6 MonthsAvailable/SeekingTotalAvailable/Seeking Total2774333884509362960111150415673937178459761554976 Males 14639465 72646311480006615264311106565308621876 Females 13103873 118630514801148888924282711280668933100 Rural17344192510702424957782259851370611164993984862 Urban103991463343912464343278171602316680983570114 Rural Males909347644178391167564612243256724097657381069 Rural Females82507166891851328213613741880347067336603793 Urban Males55459892846792312442003021054382467651240807 Urban Females485315749712015190127515547934213332329307 Source: Census India, 2011

10
DistrictsMain WorkersMarginal WorkersNon Workers Gurdaspur6257787571381719476 Kapurthala248208284165568530 Jalandhar6895927744721529551 Hoshiarpur4110114998221189992 Shahid Bhagat Singh Nagar 173507204329 442675 Fatehgarh Sahib192845214783 416102 Ludhiana 113865412848222374267 Moga304880359172699151 Firozpur6183627566951374760 Muktsar287205335326607682 Faridkot190415221555433653 Bathinda452678549986910081 Mansa247175328512481822 Patiala5703916602671335405 Amritsar7872549178561720712 Tarn Taran316310380702812851 Rupnagar194209233676495762 SAS Nagar316236356995692463 Sangrur4997925687581178583 Barnala186434209331417434 Source: Census India, 2011

12
Age GroupTotal PopulationRural PopulationUrban Population TotalMaleFemaleTotalMaleFemaleTotalMaleFemale Total8450936726463111863055107024441783968918533439122846792497120 5-9 235311433791941420787465461932455913733 10-14 66822487591806342747310101173724075177496326 15-19396263338041582222634482249623848613281511307919736 20-249457418212041245375936095185707503935213230263449498 25-29116667210030221636506685235793668915749814942365674493 30-3410876049294201581846263715378838848846123339153769696 35-3910482828878511604316132075224569075143507536539569680 40-49 178259915242342583651061769914334147435720830609900110930 50-5911105809686201419606456265685907703646495440003064924 60-69580752513402673504040423568304721217671015657220138 70-79 179325161521178041289221164701245250403450515352 80+ 5288845993 6895 3773832919481915150130742076 Age not stated 98778227165068155703111230622524538 15-597537741647239210653494472553386616160639230651882606231458957 60+812965720916920495707025062196448324226321469727566 Source: Census India, 2011

13
Total Highest :40-49 Lowest:05-09 Total Male Highest : 40-49 Lowest:05-09 Total Female Highest:40-49 Lowest:80+ Rural Highest:40-49 Lowest: 05-09 Rural Male Highest: 40-49 Lowest: 05-09 Rural Female Highest:40-49 Lowest: 80+ Urban Highest: 40-49 Lowest:05-09 Urban Males Highest: 40-49 Lowest:05-09 Urban Females Highest:40-49 Lowest:80+

14
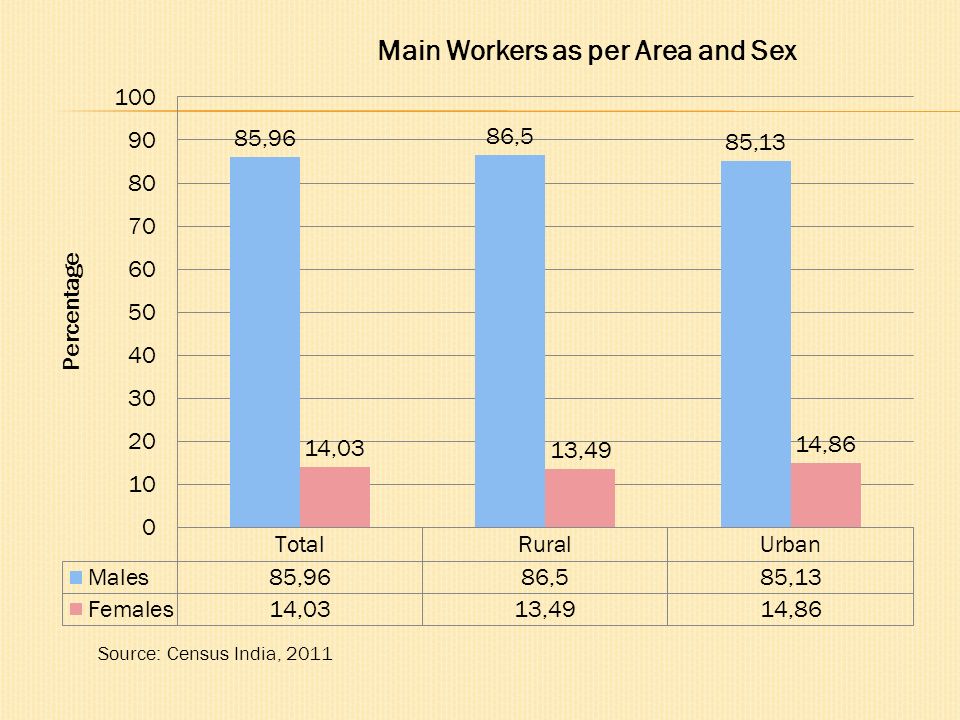
Total Main Workers = 8450936 Main Workers Rural = 5107024 (60.43%) Main Workers Urban = 3343912 (39.56%) Total Main Workers Male = 7264631 (85.96%) Total Main Workers Female= 1186305 (14.03%) Main Workers Rural Males = 4417839 (86.50%) Main Workers Rural Females = 689185 (13.49%) Main Workers Urban Males = 2846792 (85.13%) Main Workers Urban Females =497120 (14.86%) Age group with the Highest Population (Males, Females, Rural, Urban) = 40-49 Age group with the Lowest Population (Males, Females, Rural, Urban) = 05-09 Source: Census India, 2011
 Main Workers Urban = (39.56%) Total Main Workers Male = (85.96%) Total Main Workers Female= (14.03%) Main Workers Rural Males = (86.50%) Main Workers Rural Females = (13.49%) Main Workers Urban Males = (85.13%) Main Workers Urban Females = (14.86%) Age group with the Highest Population (Males, Females, Rural, Urban) = Age group with the Lowest Population (Males, Females, Rural, Urban) = Source: Census India, 2011")
17
DistrictCultivatorsAgricultural LabourersHousehold IndustryOther Workers Gurdaspur19.513.34.163.1 Kapurthala19.414.93.562.2 Jalandhar11.18.63.876.5 Hosiarpur1814.93.264 SBS Nagar20.911.14.463.7 Fatehgarh Sahib20.6103.765.7 Ludhiana 11 7.7 5.6 75.8 Moga25.522.9546.5 Ferozepur25.330.11.942.6 Muktsar25.8 33.11.5 39.5 Faridkot2424.43.747.9 Bathinda25.723.32.748.2 Mansa 32.3 27.54.1 36.1 Patiala17.113.53.665.8 Amritsar13.613.24.568.6 Tarn Taran30.421.3 5.6 42.6 Rup Nagar19.59.25.366 SAS Nagar11.5 6.1 3.8 78.6 Sangrur27.616.13.353 Barnala28.819.32.549.4 Source: Census India, 2011

18
Cultivators Highest:Mansa Lowest:Ludhiana Agricultural Labourers Highest:Muktsar Lowest:SAS Nagar Household Industry Highest:Ludhiana & Tarn Taran Lowest:Muktsar Others Highest:SAS Nagar Lowest:Mansa

19
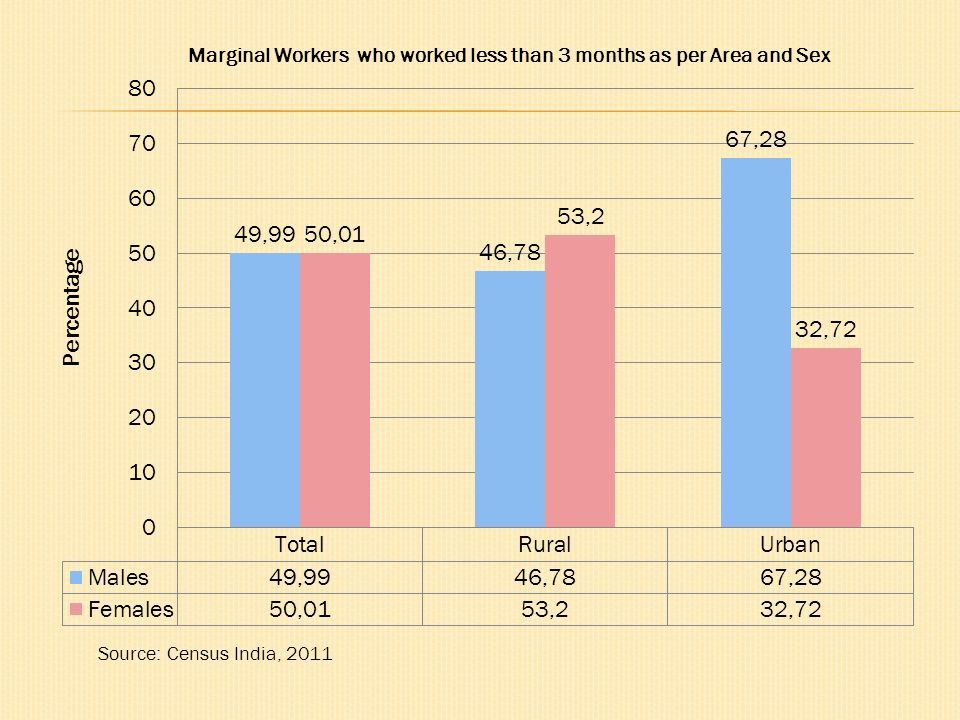
Source: Census India, 2011 Marginal Workers (worked less than 3 months) Age GroupTotal PopulationRural PopulationUrban Population TotalMaleFemaleTotalMaleFemaleTotalMaleFemale Total296011148000148011249577116756132821464343124415190 5-9 1753945 808 1420759661 333 186 147 10-149364536240028116448536311248877371 15-19361752229313882308631820412659531240891223 20-2445006 26326 1868037082 20428 16654 79245898 2026 25-29374161916618250307521450716245666446592005 30-34319871389318094268511071216139513631811955 35-3930182120851809725442930216140474027831957 40-49 46895 19113 2778239645 14767 24878 72504346 2904 50-5926048117431430522099923512864394925081441 60-69219621115410808193919394999725711760811 70-79680244382364585637332123946705241 80+20481280 768 17381057681 310 223 87 Age not stated373202171322173149512922 15-59 25370912461912909021273497155115579409752746413511 60+ 308121687213940269851418412801382726881139
 Age GroupTotal PopulationRural PopulationUrban Population TotalMaleFemaleTotalMaleFemaleTotalMaleFemale Total Age not stated")
20
Source: Census India, 2011

22
Marginal Workers (worked for 3 to 6 months) Age GroupTotal PopulationRural PopulationUrban Population TotalMaleFemaleTotalMaleFemaleTotalMaleFemale Total1150415661526488889822598461224361374327817200302127515 5-927360151981216212643697956641471782196498 10-1447815276812013426754154611129321061122208841 15-191260838220543878881575736230795379262484313083 20-24176782 113405 63377125992 80202 45790 5079033203 17587 25-2915057289830607421068116246444347437612736616395 30-341242436767556568907474760443143334962007113425 35-391149575937155586853184225843060296391711312526 40-49 180198 92660 87538134582 66273 68309 4561626387 19229 50-59991845311846066727533733335420264311578510646 60-697134340371309725527830429248491606599426123 70-792210214209789316528106965832557435132061 80+ 77364601313554993277222222371324913 Age not stated204012028381536886650504316188 15-59 972019558264413755704360393496310864267659164768102891 60+ 101181591814200077305444023290323876147799097
 Age GroupTotal PopulationRural PopulationUrban Population TotalMaleFemaleTotalMaleFemaleTotalMaleFemale Total Age not stated")
23
Source: Census India, 2011

25
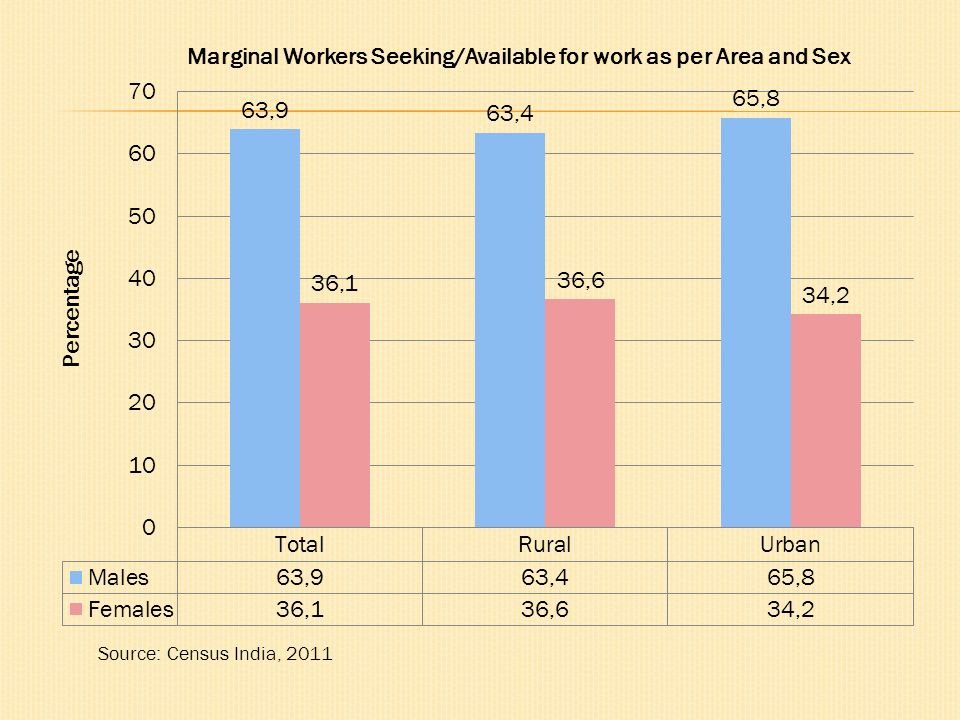
Marginal Workers ( Seeking / available for work) Age GroupTotal PopulationRural PopulationUrban Population TotalMaleFemaleTotalMaleFemaleTotalMaleFemale Total67393743111024282751370632567218803416023110543854793 5-9823746653572446725251942377021401630 10-14209651278081851388584225463708043582722 15-1991976633932858369088473812170722888160126876 20-24 1301888938140807968256667130154333632271010653 25-2999698649703472874115481202599525583168508733 30-3475060453312972958117346452347216943106866257 35-396656938717278525238729911224761418288065376 40-4995114566303848475594442353135919520123957125 50-59450562849816558357212212413597933563742961 60-6929864189771088724588154219167527635561720 70-7977655531223462534472178115121059453 80+ 2466160985718581223635608386222 Age not stated 97962835180852228617110665 15-59 6036613869202167414618472930871687601418149383347981 60+ 400952611713978326992111611583739650012395
 Age GroupTotal PopulationRural PopulationUrban Population TotalMaleFemaleTotalMaleFemaleTotalMaleFemale Total Age not stated")
26
Source: Census India, 2011

28
Total Highest :40-49 Lowest:05-09 Total Male Highest :20-24 Lowest:05-09 Total Female Highest:40-49 Lowest:80+ Rural Highest:40-49 Lowest: 05-09 Rural Male Highest:20-24 Lowest: 05-09 Rural Female Highest:40-49 Lowest: 05-09 Urban Highest:20-24 Lowest:80+ Urban Males Highest:20-24 Lowest:05-09 Urban Females Highest:40-49 Lowest:80+ Total Highest :40-49 Lowest: 80+ Total Male Highest :20-24 Lowest: 80+ Total Female Highest:40-49 Lowest:80+ Rural Highest:40-49 Lowest: 80+ Rural Male Highest:20-24 Lowest: 80+ Rural Female Highest:40-49 Lowest: 80+ Urban Highest:20-24 Lowest:80+ Urban Males Highest:20-24 Lowest: 80+ Urban Females Highest:40-49 Lowest:80+ Total Highest :20-24 Lowest:80+ Total Male Highest :20-24 Lowest:80+ Total Female Highest :20-24 Lowest:80+ Rural Highest :20-24 Lowest:80+ Rural Male Highest :20-24 Lowest:80+ Rural Female Highest :20-24 Lowest:80+ Urban Highest:20-24 Lowest:80+ Urban Males Highest :20-24 Lowest:80+ Urban Females Highest :20-24 Lowest:80+

29
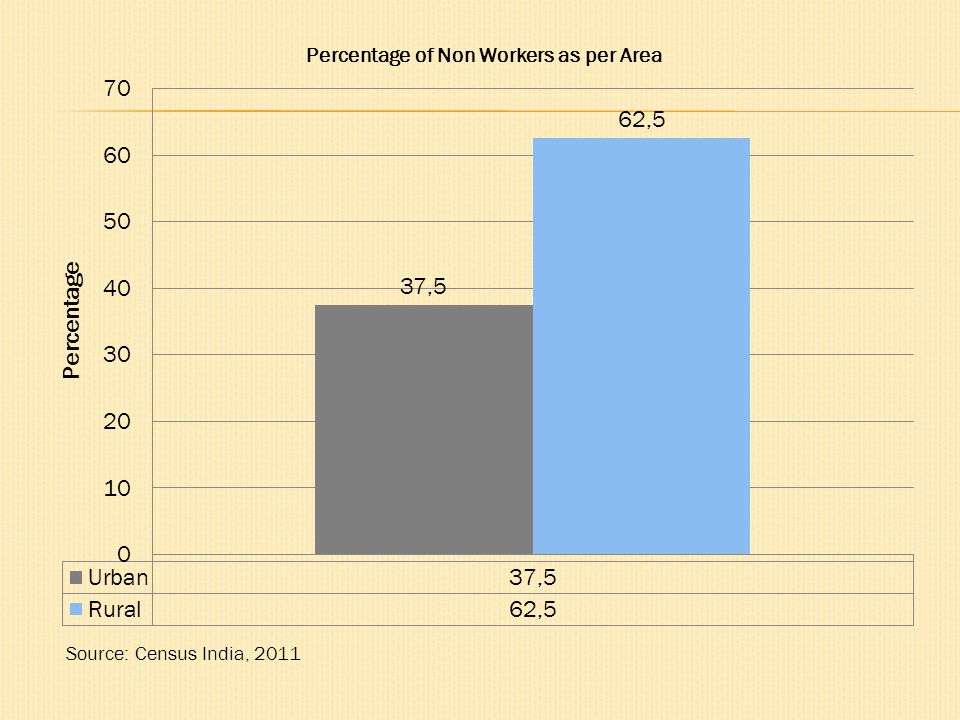
Non-workers Age GroupTotal PopulationRural PopulationUrban Population TotalMaleFemaleTotalMaleFemaleTotalMaleFemale Total178459766565308112806681116499340976577067336668098324676514213332 5-92315375127120210441731478752811421667331836623459781376842 10-14 24594011363728 1095673 1591211880410 710801 868190483318 384872 15-192259162112764111315211431959703303728656827203424338402865 20-2416091075045961104511950150269539680611658957235057423900 25-2911092011583879508146493708185956751145983176528383303 30-34872705715458011605195374006947946835316831476321692 35-39795650 51555 744095478875 30233 448642316775 21322 295453 40-49136654891336 1275212 83159056115 775475 53495835221 499737 50-599752071160288591795785256650151202439668249527347155 60-691042121290362751759672129170996501133369992119366250626 70-7956190922215533975438078314958623119718112672569108557 80+ 316829 134176 182653229806 98570 131236 87023 35606 51417 Age not stated29232126411659120937907111866829535704725 15-59 89875802121088686649254400061247619419238735475748734692674105 60+ 192085964669312741661282718419152863566638141227541410600 Source: Census India, 2011

32
Non – Workers ( Seeking / available for work) Age GroupTotal PopulationRural PopulationUrban Population TotalMaleFemaleTotalMaleFemaleTotalMaleFemale Total1554976621876933100984862381069603793570114240807329307 5-92332113076102451493683886548838546883697 10-1457302340052329738868227331613518434112727162 15-19388698 229756 158942 260771150833 1099381279277892349004 20-24 419649 194091 225558 254681112486 1421951649688160583363 25-29231211665811646301343633541398950968483116865680 30-34121962223819958174241126106163147721977137950 35-399129112571787205747775234995433814504828766 40-49113788173339645575195108196437638593651432079 50-595276811942408263524770332821417521490912612 60-69398511354726304281508569195811170149786723 70-791032545645761747832254253284713391508 80+ 34181436198224419961445977440537 Age not stated13925937991014441573378152226 15-59 1419367554655864712891975336717555258527392217938309454 60+ 5359419547340473806912790252791552567578768
 Age GroupTotal PopulationRural PopulationUrban Population TotalMaleFemaleTotalMaleFemaleTotalMaleFemale Total Age not stated")
33
Source: Census India, 2011

34
Total Highest :10-14 Lowest:80+ Total Male Highest :10-14 Lowest:35-39 Total Female Highest:40-49 Lowest:80+ Rural Highest: 10-14 Lowest: 80+ Rural Male Highest:10-14 Lowest: 35-39 Rural Female Highest:40-49 Lowest: 80+ Urban Highest:10-14 Lowest:80+ Urban Males Highest:10-14 Lowest:35-39 Urban Females Highest:40-49 Lowest:80+ Total Highest :20-14 Lowest:80+ Total Male Highest :15-19 Lowest:80+ Total Female Highest:20-24 Lowest:80+ Rural Highest:15-19 Lowest: 80+ Rural Male Highest:15-19 Lowest: 80+ Rural Female Highest:20-24 Lowest: 80+ Urban Highest:20-24 Lowest: 80+ Urban Males Highest:20-24 Lowest: 80+ Urban Females Highest:20-24 Lowest: 80+

Similar presentations


>")


