Download presentation
Presentation is loading. Please wait.

1
Modeling and Visualizing Species Movement Presented at: NASA Joint Science Workshop on Biodiversity, Terrestrial Ecology, and Applied Science College Park, Maryland, August 21-25, 2006 Funding: NASA NCC2-1186 & NCC13-03009, NSF DEB 0074444 & DEB-0413570, and NPS Fred Watson 1 Simon Cornish 1 Simon Cornish 1 Bob Garrott 2 Bob Garrott 2 PJ White 3 PJ White 3 Rick Wallen 3 Rick Wallen 3 Susan Alexander 1 Susan Alexander 1 Wendi Newman 1 Wendi Newman 1 Thor Anderson 1 Thor Anderson 1 Jon Detka 1 Jon Detka 1 Jason Bruggeman 2 Jason Bruggeman 2 1 California State University Monterey Bay 2 Montana State University Bozeman 3 National Park Service

2
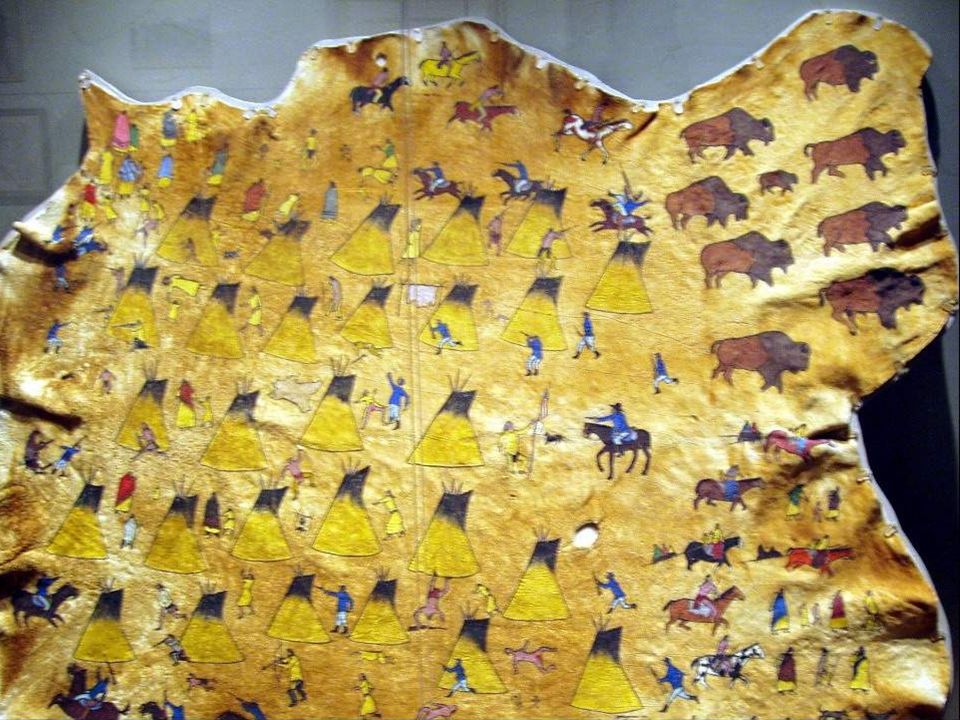
National Parks Service bison monitoring & management activities

3
A selection of products in the pipeline Landscape visualization kiosk –Canyon Visitor Education Center Real-time snowpack modeling –Information that supports bison management at the boundary Landscape inputs to wildlife studies –The hard science upon which policy is based A model for predicting species movement –Potential contributions to any application where species move: biodiversity invasive species ecological forecasting disease vectors

4
Landscape visualization kiosk

6
Real-time snowpack modeling

7
Landscape model (snowpack) helps inform decision on when to release bison Optimal time for release?
 helps inform decision on when to release bison Optimal time for release")
8
The cold face of collaboration

9
Landscape inputs to wildlife studies Pr( Use of location by species ) = f ( Landscape covariates,,,Temporal covariates,,, )
 = f ( Landscape covariates,,,Temporal covariates,,, )")
10
Landscape inputs to wildlife studies Probability of bison corridor travel (Bruggeman et al., submitted)
")
12
Some false positives Probability of bison corridor travel (Bruggeman et al., submitted)
")
13
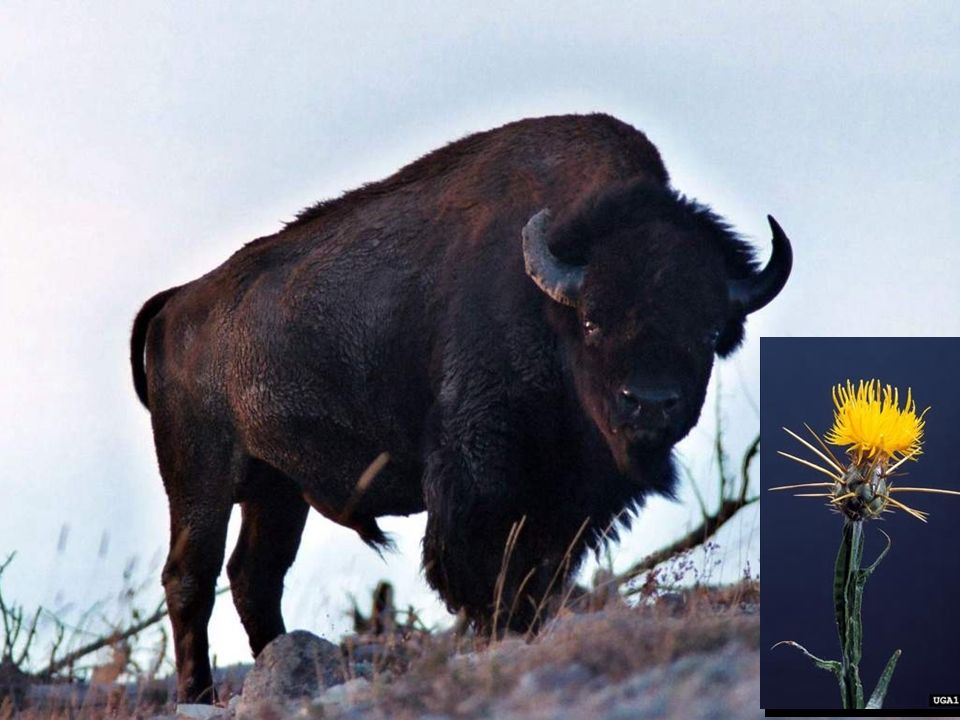
Bison distribution & landscape covariates Vegetation Slope Snowpack

14
Bison utilization distribution: Habitat-selection analysis using standard Resource Selection Functions (RSFs)
")
15
Two paradigms 1.Pr( Use ) = f ( Landscape covariates ) 2.Pr( Use ) = f (Distance to previous locations)
 = f ( Landscape covariates ) 2.Pr( Use ) = f (Distance to previous locations)")
16
Two paradigms

17
A new approach: Selective Computational Diffusion (SCD) Pr( Use here ) = Pr( Use next door ) * f ( Landscape here ) Iterated many times (computationally demanding)
 Pr( Use here ) = Pr( Use next door ) * f ( Landscape here ) Iterated many times (computationally demanding)")
18
Comparison of approaches

19
Taking SCD out on the road (so to speak!) --- Observed movement --- Predicted movement
 --- Observed movement --- Predicted movement")
Similar presentations


 Fred Watson.>")
>")


 Project Daniel J. Bramer University Of Illinois at Urbana-Champaign.>")


,>")

